Market Valuations: Do they Still Matter?
“Price is what you pay; value is what you get.” B. Graham
“In the short run, the market is a voting machine, but in the long run it is a weighing machine.” B. Graham
“Value investing is at its core the marriage of a contrarian streak and a calculator.” S. Klarman
"Never confuse genius with a bull market." J. Bogle
“The first principle is that you must not fool yourself, and you are the easier person to fool.” R. Feynman
When equity markets seem unstoppable, rising relentlessly on good, bad or no news, investors slowly forget that value is an anchor to price. When markets have been quasi invincible for more than a decade, with every decline recouped extremely rapidly, investors stop thinking critically. Reflection becomes a liability.
Buy The Dips works so well, let's build a narrative around it. This time it is really different! Is it?
Central Banks around the world, by lowering interest rates aggressively and expressing support, verbally and/or materially, to the markets at the slightest emergence of stress, by taking too much time or even refusing to remove the accommodations they provided, have set the stage for historical market and social dislocations.
When finance dominates everything, when companies' management are obsessed by financial engineering and short-term personal rewards, when governments/central banks/regulators are controlled and not controlling, dogmatic and not pragmatic, the end result cannot be good. While we will expand on this in a next installment, Ben Hunt of Epsilon theory has written extensively and brilliantly on the subject. One could start here.
Bubbles need leverage to develop. Rates below a certain level could have a detrimental effect for the real economy as investment in new productive capital become less and less elastic to rates decline on their way to 0%, zombie companies survive, preventing the Schumpetarian creative destruction, leaving excess supply in place, pushing inflation rate down (what? low rates could be deflationary?) and savers have to spend less as their capital returns decline. The only thing striving is finance where actors put on more and more leverage to buy existing capital (buybacks, M&A, dividend payment to private equity firm,...).
The consequence is increased debt unbacked by new productive capital. A system where overall debt can not be repaid, ever. A system where the can is kicked down the road until it can't anymore.
The end game is either an inflationary burst to save the debtors, a multi-decades slow growth environment or a deflationary burst. Given that the debtors are governments, interest groups lobbying them and Generation X and the younger ones (who will soon dominate the electorate), we have little doubt that the inflationary scenario is the most probable by far.
So what should stock market price represent? Stocks are a claim on future cash flows. In order to assess their value today, we have to calculate their present value using an appropriate discount rate. Doing this we get what is commonly called the intrinsic value of a stock or of a group of stocks.
At a given discount rate, the short-term fluctuations of cash flows have very little influence on a market intrinsic value. Remove entirely 1 or 2 years of cash flow and the difference will be small. Changing the discount rate, on the other hand, can have a huge impact.
Discount rate assumptions backed by market participants are strongly correlated with their mood. Bullish participants will accept a lower discount rate, ceteris paribus.
Prevailing interest rates usually serve as a loose anchor to discount rate assumptions. We can nevertheless see, experimentally, an increased exposure to risky assets the lower the risk-free rate is, even when the mean excess return is the same.
On the graph below, one can see the average allocations to a risky asset across different interest rate conditions. Each condition has 200 participants, from the MTurk platform. The x-axis shows the risk-free rate in each condition. The mean excess return on the risky asset is 5% in all conditions.
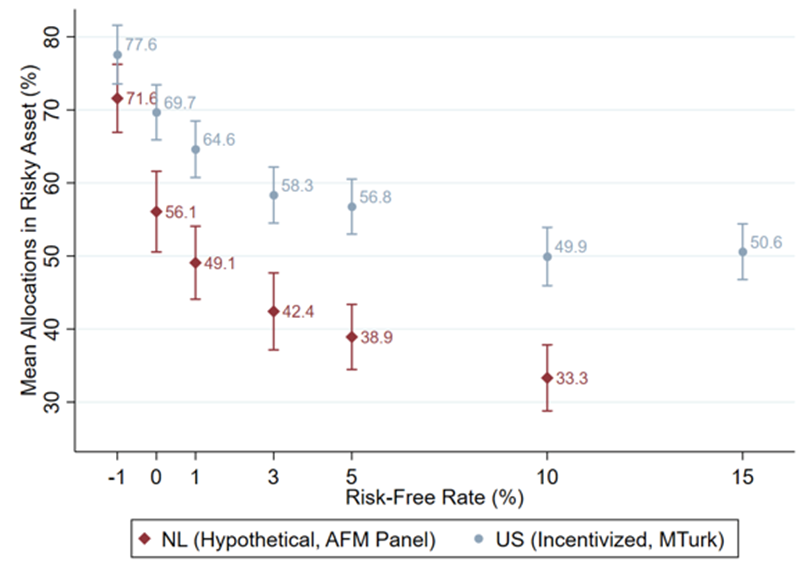
The current environment of extreme bullishness combined with low (0%) short-term rate is an explosive combination.
So explosive that the US S&P 500 is, at today's level, the most overvalued it has ever been. We will demonstrate it using a methodology proposed by J. Hussman, the Margin-Adjusted Cyclically-Adjusted Price Earning Ratio (MAPE). J. Hussman is, unknowingly, the investor who has inspired our whole career in finance when, freshly graduated we stumbled upon his writings in early 2000. From his valuation analysis to his market environment analysis or his quantitative stock selection methodology, most of our research started from one of his commentary (and we hope we have also integrated at least some of his com(passionated), altruistic way of life).
R. Shiller and J. Campell proposed the concept Cyclically-Adjusted Price Earning (CAPE) to forecast 7-12 years markets future return using a long moving average of earnings (originally 10 years) back in 1988. The goal was to smooth out the business cycle influence on earnings in order to get a smoother series they called trend earnings.
The CAPE model was good at forecasting forward return in the past (M. Faber applied it to foreign markets too) but some argue that accounting changes, payout policies, a move toward less competitive markets could have made the CAPE model lose some or even most of its forecasting ability. One can find some great discussion on the subject here and here.
R. Shiller introduced the Cyclically-Adjusted Total Return Price Earning Ratio to account for the change in company payout policies with the increased use of buybacks to return capital to shareholders.
Two flaws remained nevertheless.
First, as identified by J. Hussman, one can get an even smoother trend earning series by adjusting the CAPE to get constant historical margins. He uses 5.4% margin as its average. So if the most recent 10 years average margin is 7%, one ought to multiply the CAPE by 7%/5.4% (1.3). A CAPE of 30 becomes a MAPE of 40.
The second problem is that margin could have increased permanently due to structural change in the economy and the dominance of capital-light businesses.
While this might explain some of the increase in margin, we are convinced that a large part of the increase in margin is transitory and that once capitalism is allowed to work as it should, it will disappear. It will be the subject for another article.
Anyhow, we have assumed a permanent increase of margin to 7% starting in 1998 with the emergence of internet.
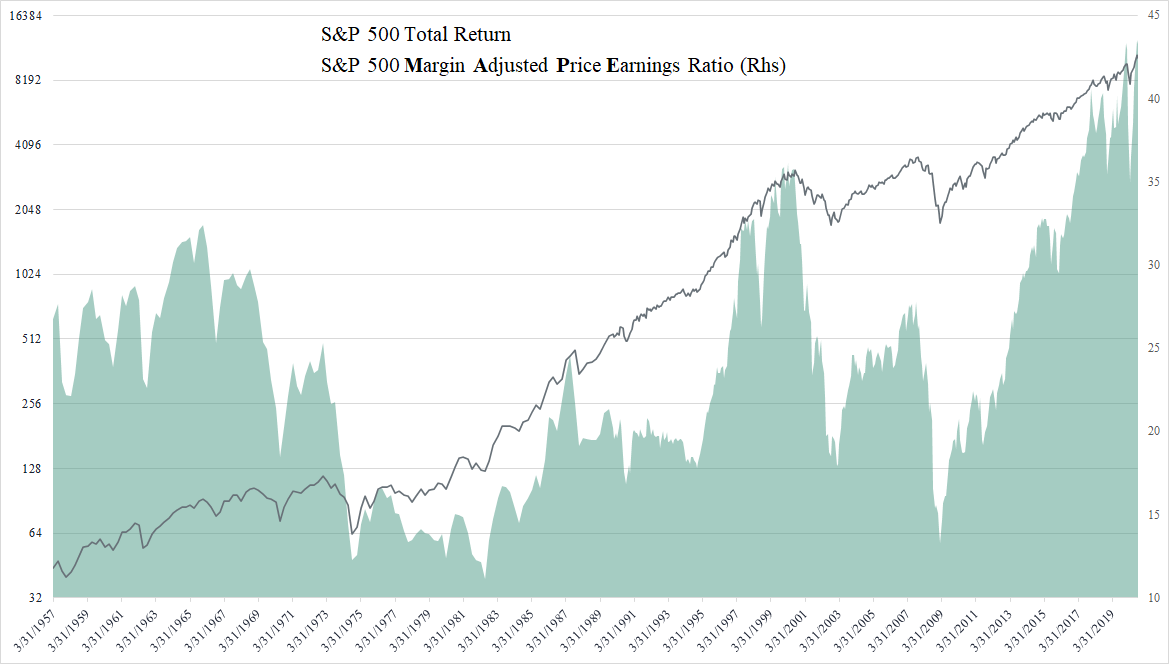
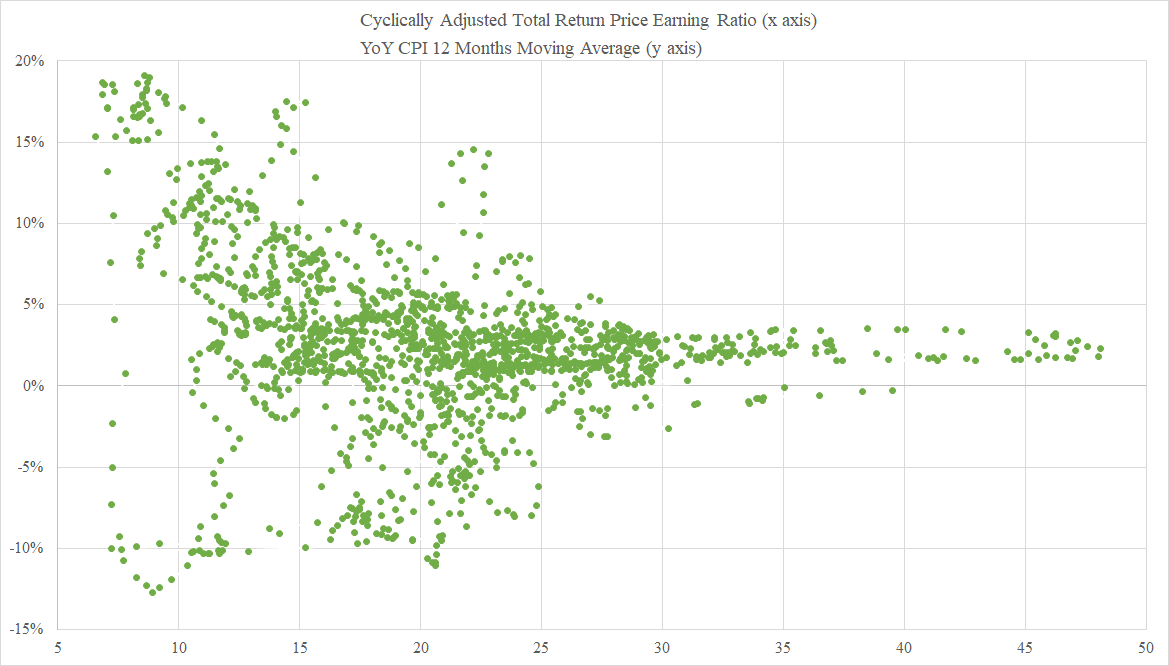
Let's now look at the data.
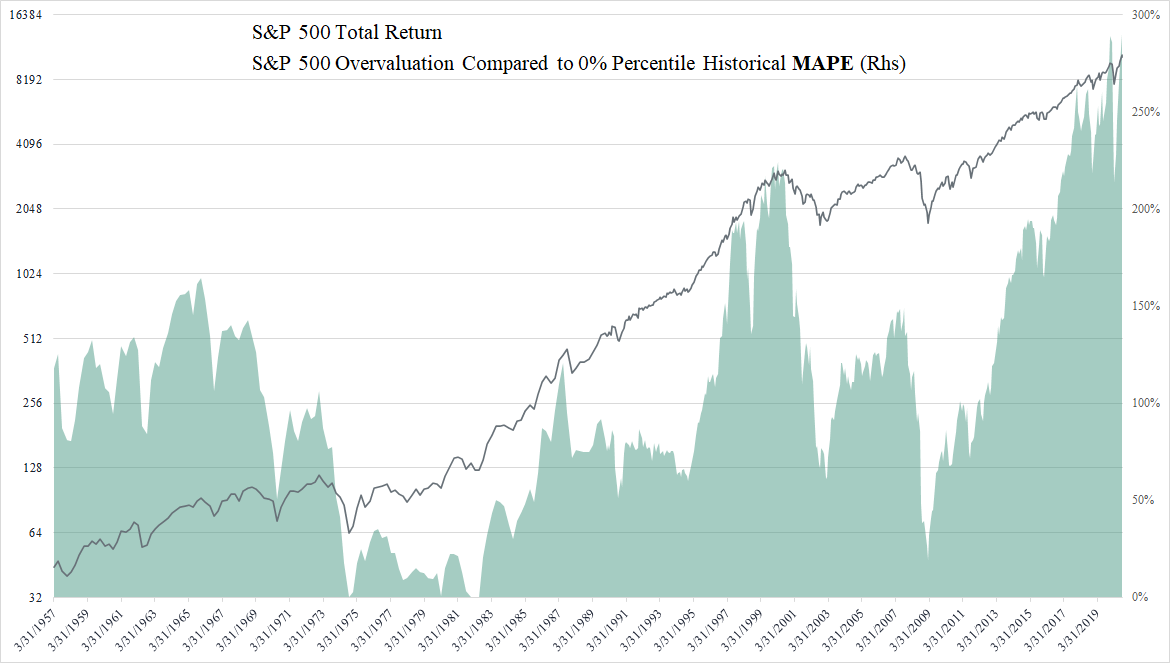
As one can see, today's MAPE is the highest it has ever been, dwarfing the 2000 Tech Bubble. Two years ago the overvaluation was widespread with every segments (large, small, value, growth,...) affected, leaving no place to hide.
The situation is different now and is starting to be similar to the 2000 episode.
Indeed, the extreme overvaluation is concentrated in some sectors and large cap names while value(bis) and small cap stocks are undervalued (even deeply undervalued for value stocks, especially if the inflation scenario materialize) on a relative basis.
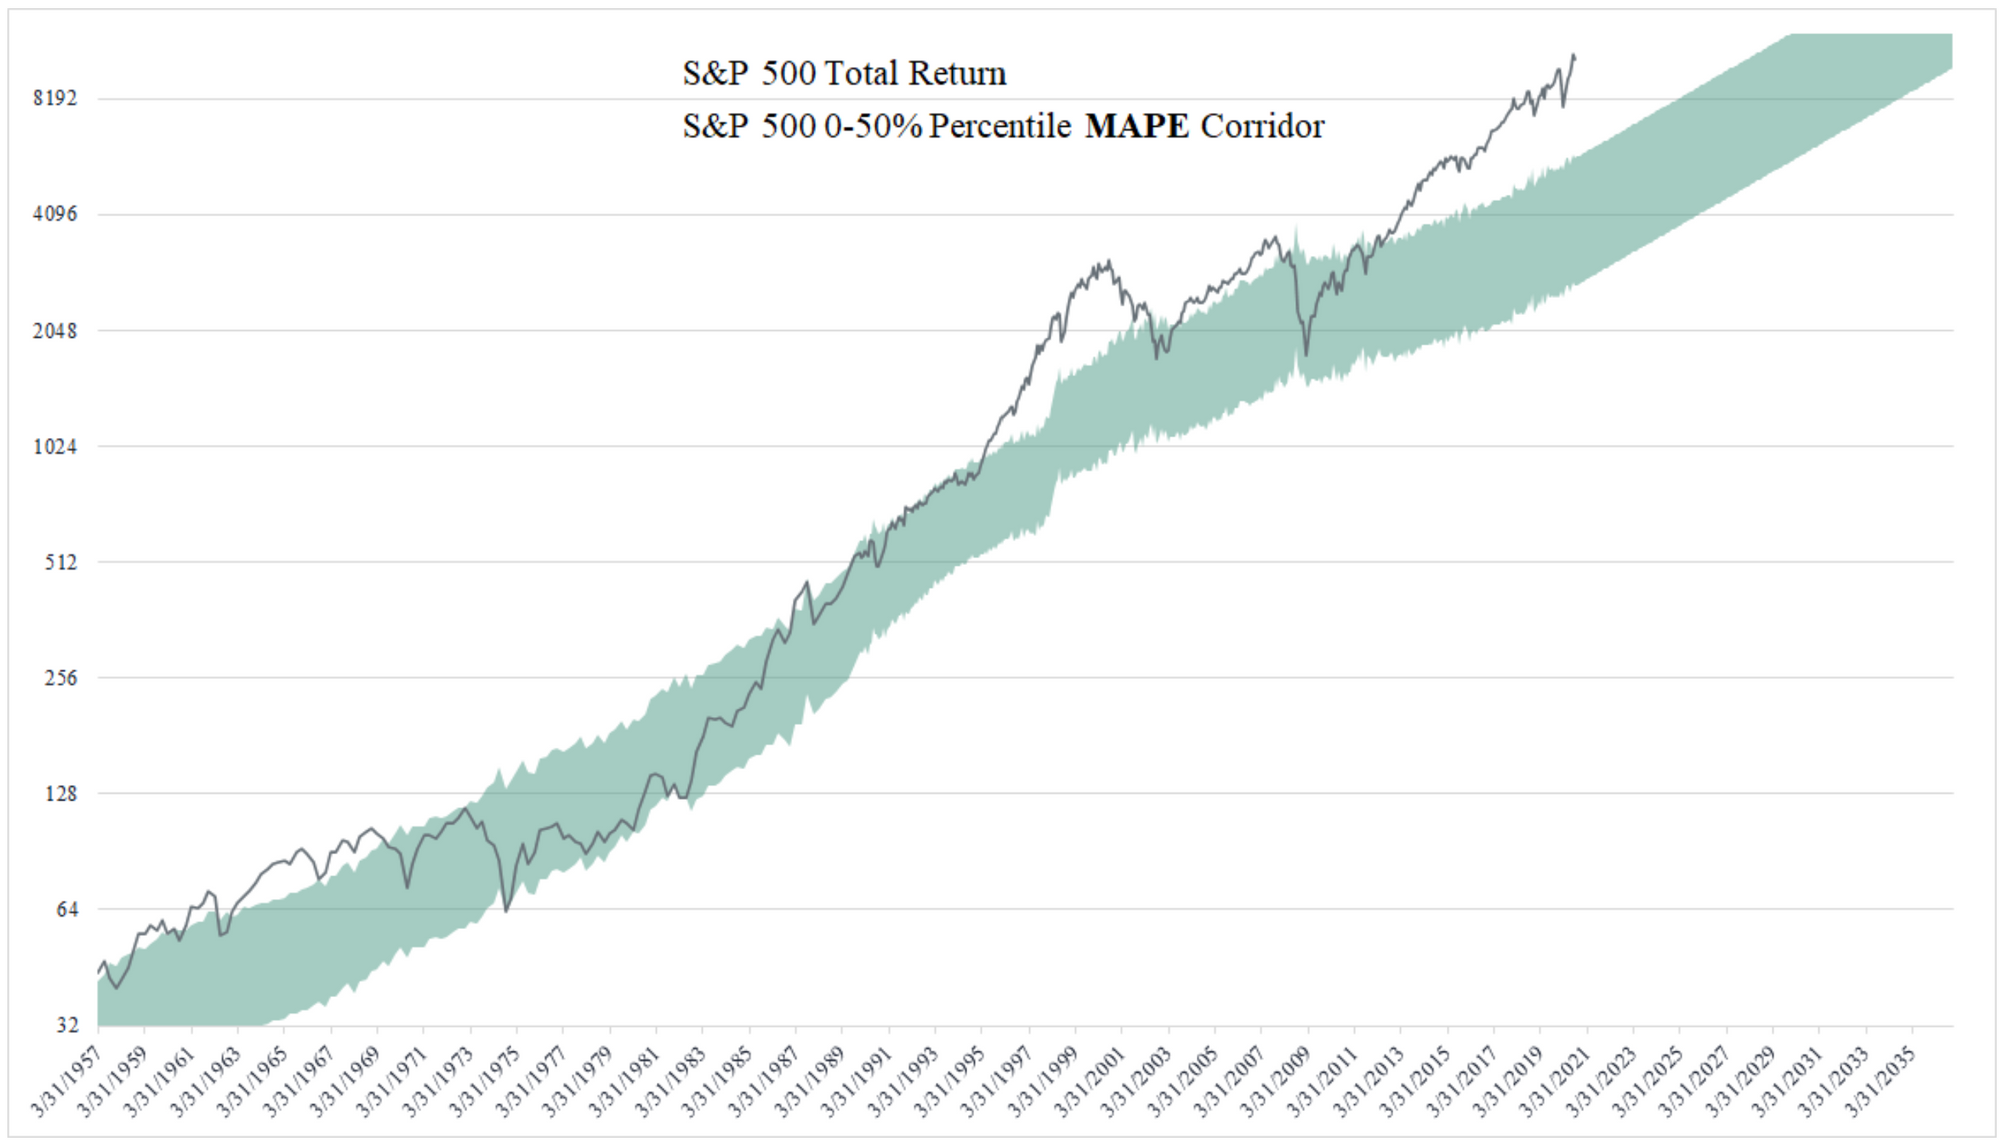
If we construct an historical corridor with boundaries between the 0% and 50% percentiles of MAPE history, the prospect looks grim for Buy and Holders.
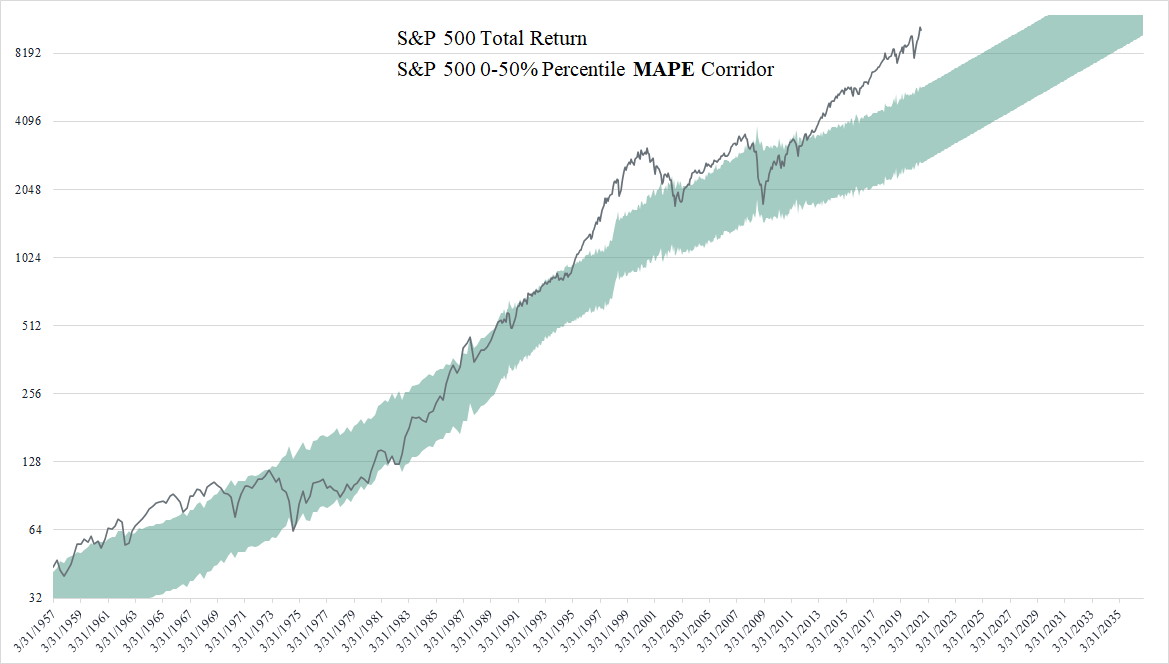
The S&P 500 is currently almost 300% above the level corresponding to a bottom MAPE and 80% above the 50% percentile MAPE history.
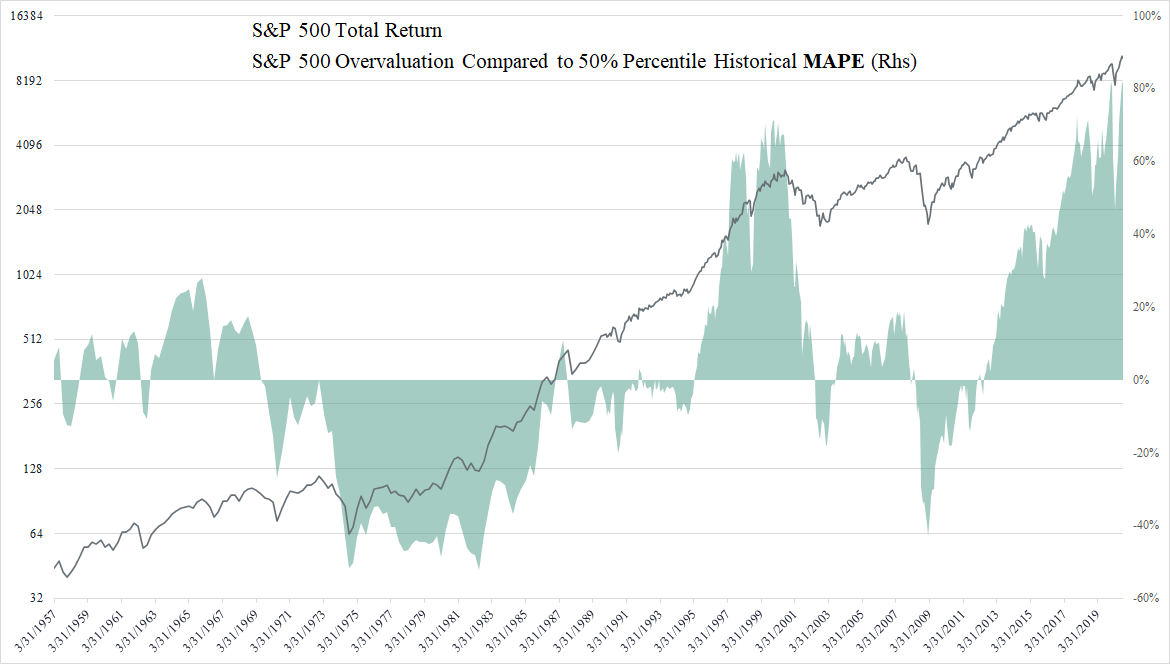
If we assumed a return to the MAPE lows or to the MAPE 50% percentiles, with nominal trend earnings growing at their historical pace and the current 2% dividend yield, one can see that the S&P 500 total return nominal CAGR to January 2030 would be between -6.27% and 1.68%. Given the historical tendency of deeply overvalued markets to fall significantly below the 50% percentile MAPE, being positioned for positive total return would be unwise.
It is also important to remember that today's margin are above our 7% assumption and that the CBO is projecting 4.1% real US GDP growth to 2030. The odds are thus stacked against the >6% real earning growth we have assumed

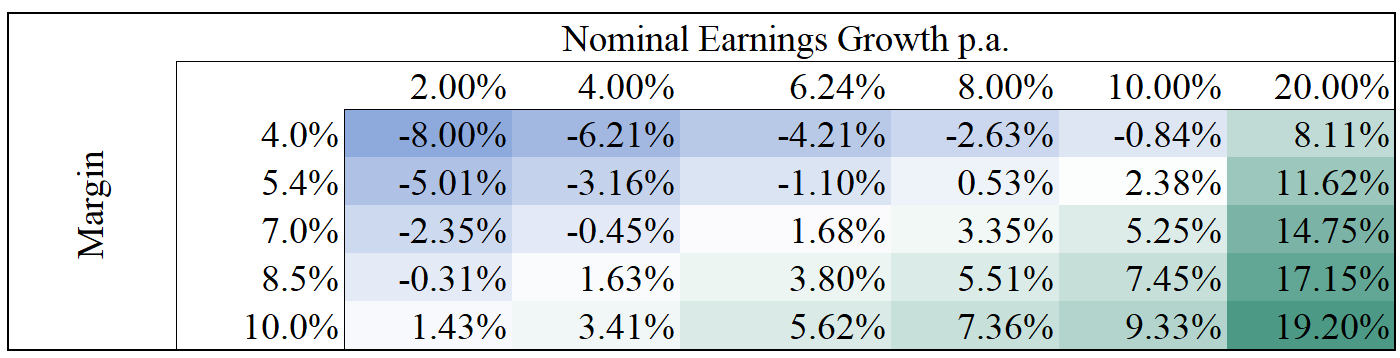
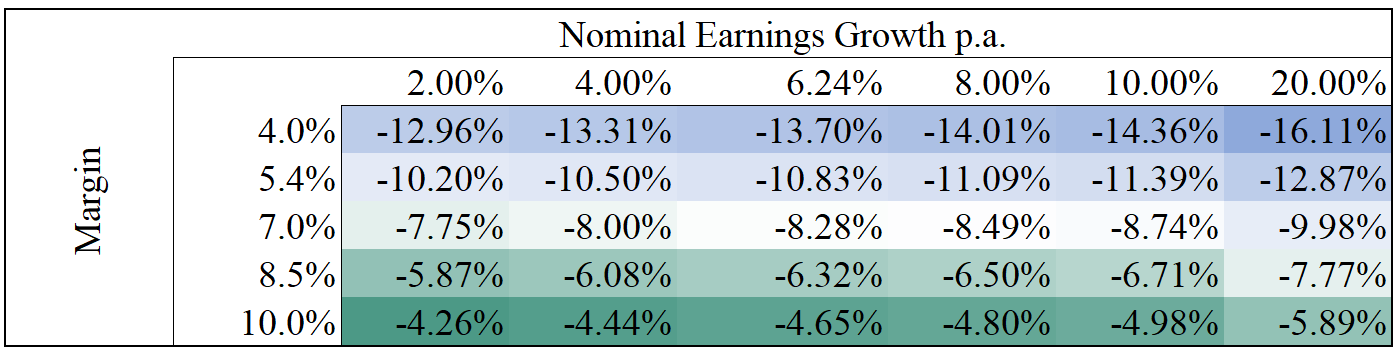
A factor we have alluded to before which could have a large influence on nominal returns is inflation. To see the sensitivity of forward nominal total return to various inflation and margin scenarios we have created the following tables.
They indicate the S&P 500 total return until January 2030 with various forward nominal earning growth and margins.
Nominal total return if we reach 0% percentile MAPE in January 2030:

Nominal total return if we reach 50% percentile MAPE in January 2030:
Real total return if we reach 0% percentile MAPE in January 2030:
Real total return if we reach 50% percentile MAPE in January 2030:
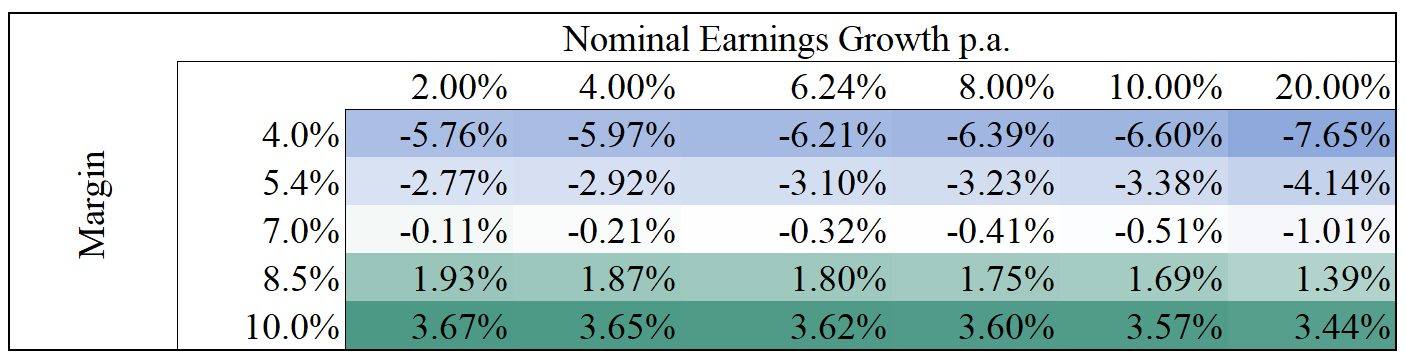
One can see that positive nominal returns are only achieved in a very high inflation environment (>15% annual inflation) at a 0% percentile MAPE in 2030.
One has also to be aware that the price investors are ready to pay for each unit of earning does not have a linear relationship with inflation. The always insightful Ed Easterling of Crestmont Research dubbed it the "Y curve effect".
Equity markets participants like moderate to low, steady inflation. High inflation or deflation have historically led to contracting MAPE. This imply that in a high inflation scenario the risk of hitting the MAPE lower bound increases.
In this brief note, which will be the basis for many more to come, our goal was to demonstrate as objectively as possible how far from intrinsic value the S&P 500 is today. Paraphrasing B. de Chartres, we stood on the shoulders of giants to do so.
The S&P 500 is not likely to have a positive nominal total return in the next 10 years and it would need a miracle to achieve positive real returns. Central Banks, with their accommodative policies and hyper-sensibility to volatility have brought forward future equity returns (and some more).
With risk-free and corporate fixed income yields at record low, passive investors are up for a painful decade.
We have written about our enhanced indices and our Sentinel models in the past. Combined with market timing methodology (article coming soon) and our flexible quantitative asset rotation framework (more details in the future), it should enable investors to navigate this difficult period.
As always, we encourage readers to subscribe to our mailing list to get new articles as soon as they are published. We also appreciate your questions and commentaries which are helpful and have lead to thoughtful exchanges. They can be sent to research@nava.capital
We have also put online some of the internal tools we used to generate the equity curves, statistics, factor attribution and others we use in our article.
Feel free to use them. If you wish enhancement you can reach us at tools@nava.capital