Enhanced Indices: Let's be passively active.
"In the longer run and for wide-reaching issues, more creative solutions tend to come from imaginative interdisciplinary collaboration."
Robert Shiller
In this post we will tackle the subject of passive equity investing and how we think it can be improved. To do so we will present our enhanced index family.
A large sample of example are presented at the end of this article. Those models are a great alternative to passive index investment and crowded traditional quant funds.
Debates between the disciples of various investment methodologies are frequent and can sometimes be heated. Should I invest passively or actively? Are discretionary manager better than quantitative one? Fundamental or technical analysis? Are markets efficient or not?
From the onset, our investment philosophy has been to be agnostic to any particular school of thoughts. Why choose?
Would you rather have the perspective on a problem from experts in different domains or not?
If a similar conclusion is reached using different thought processes, one should be more confident that it is the correct one.
Investing has a lot in common with biology. Life has endured for billions of years under changing and sometimes very hostile conditions.
This was possible due to the uncanny capacity of biological forms to select and combine the characteristics that best guaranteed its survival. Another essential element, both at the micro and macro level, has been diversity. It made the risk of extinction when faced with adverse or unforeseen elements much lower.
We invest by selecting and combining some original and many old ideas emanating from brilliant minds from various fields. Our expertise resides in the mixing and dicing of those ideas, a deep knowledge of their underlying rationale and the understanding of the dynamics of their respective interactions.
We are obsessed with diversification.
So how are our enhanced indices different.
In one word, Ensemble.
We always aim at the extreme tail of the factors we use. We are not looking at the cheapest decile, the less volatile one or the one with the highest momentum. Most of our screens select only between 5-10 stocks.
We express the factors with various flavors. Momentum can be the traditional 12-1 months formula popularized by Jegadeesh and Titman in 1993 but it can also be a smoothed version, a relative and/or volatility adjusted, observation windows can vary and so on and so forth. The same is true for volatility, valuation, growth, quality, capital allocation, sentiment,...
We combine various factors family together in each screens. One can combine value with momentum, another value with quality, while a third one growth value and sentiment.
The end result is slightly more than 30 long and 20 short screens which are combined together and rebalanced on a monthly basis (performance is similar with a quarterly rebalancing but as our next article will be about the inclusion of those enhanced indices in a simple monthly asset rotation model we choose to show the monthly rebalancing graphs and stats).
The screens used, originally developed on the US markets between 2005-2007, are the same for the various country/regional indices (US markets traded live since September 2006, international since February 2015). Some do not work well in some markets but we use them anyway. There is always a rationale behind each model and removing them would be overcompensation.
The long portfolio holds between 60-250 stocks depending on the index (up to 30% of the index components) and the short portfolio between 40-100 stocks. The screens are equal-weighted
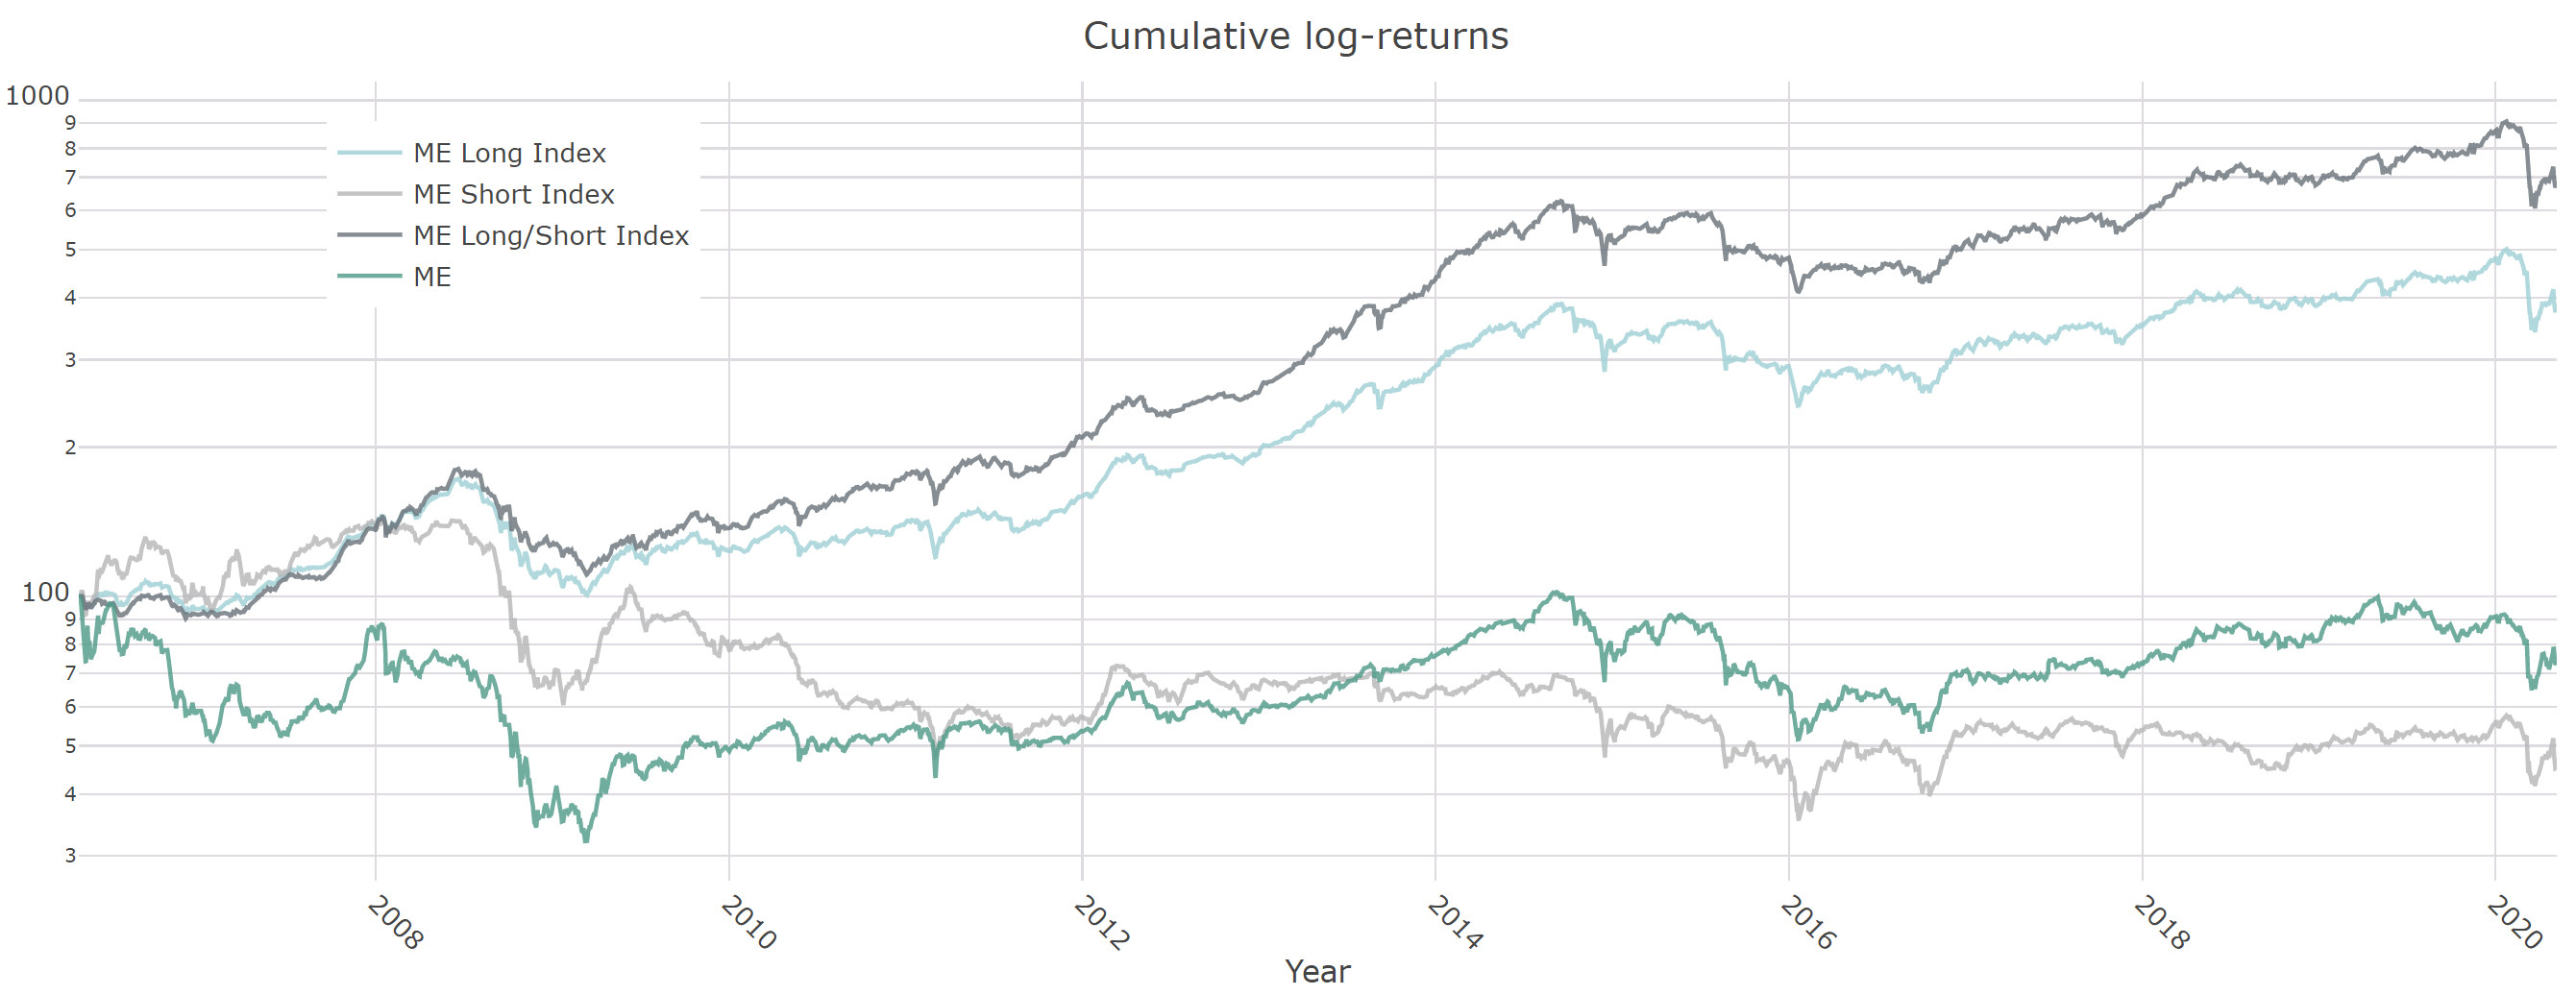
Before we present the stats we can say that our screens combination outperform every markets by a wide margin making them ideal candidates to replace traditional passive index products. The universal out-performance and its linearity reinforce our conviction of the methodology robustness. This conviction is reinforced by the size of the portfolios which, being relatively large, ensure that the out-performance is not due to a handful of outliers.
The minimum daily liquidity requirements (average turnover over a certain period) varies between USD 1-5 Mio depending on the index.
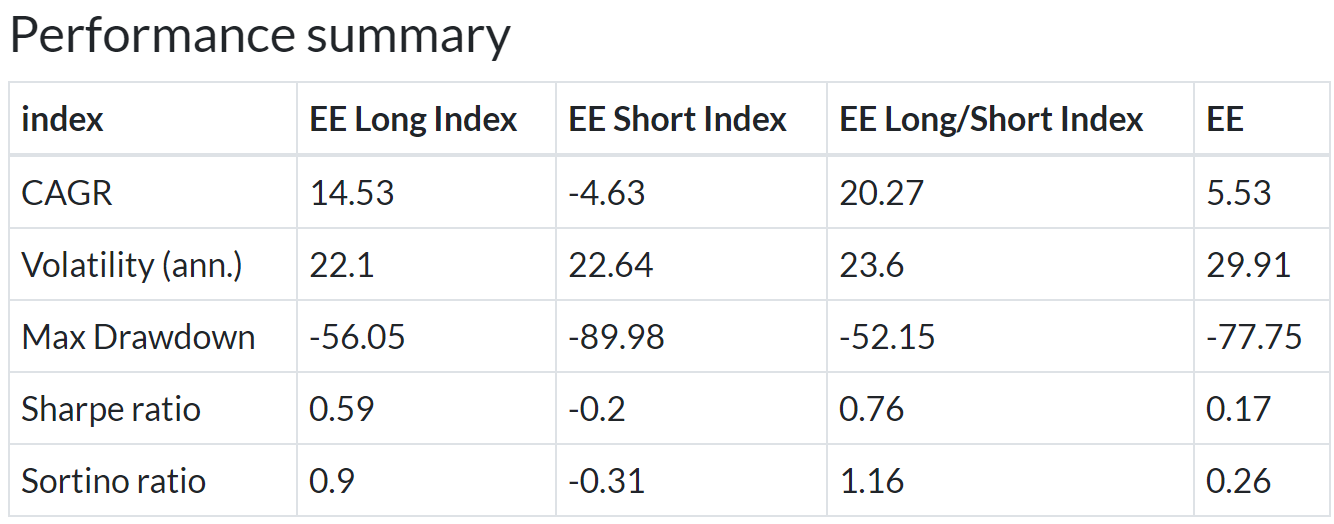
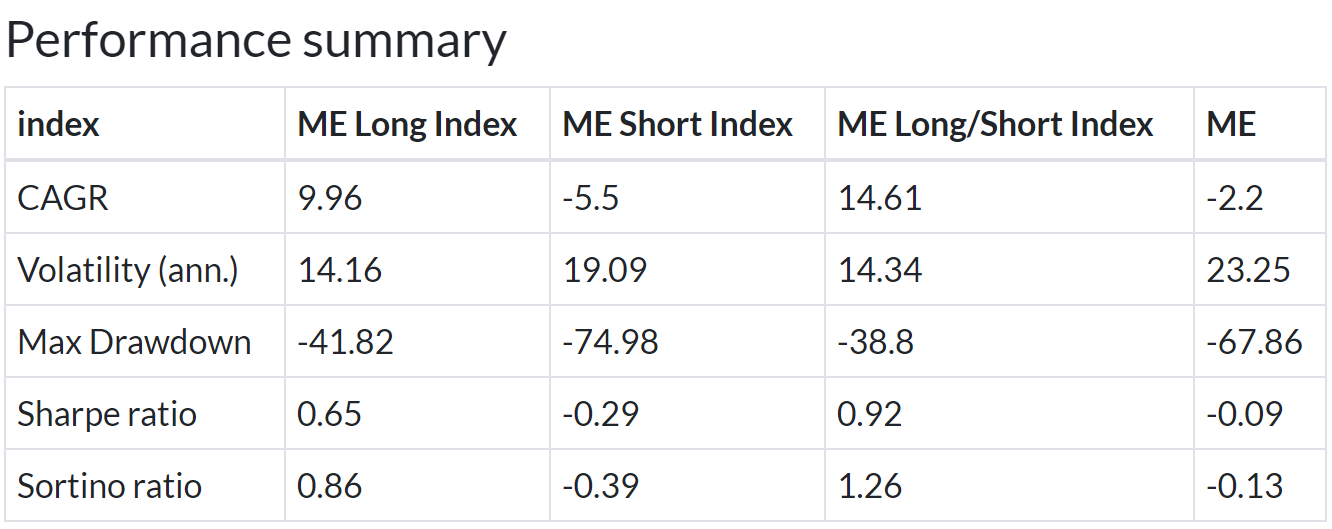
Short Index curves show the performance of the selected positions in a long portfolio. Contrary to most quantitative strategies, our short picks don't come from the bottom distribution of our long screens (they are not top & bottom of the same screen).
Long/Short indices represent a 130% long position in the "Long Index" & a 30% short position in the "Short Index". Long/short indices are rebalanced monthly.
We penalize Long/Short index by 2% per year to account for the cost of shorting.
All the performance presented are in USD.
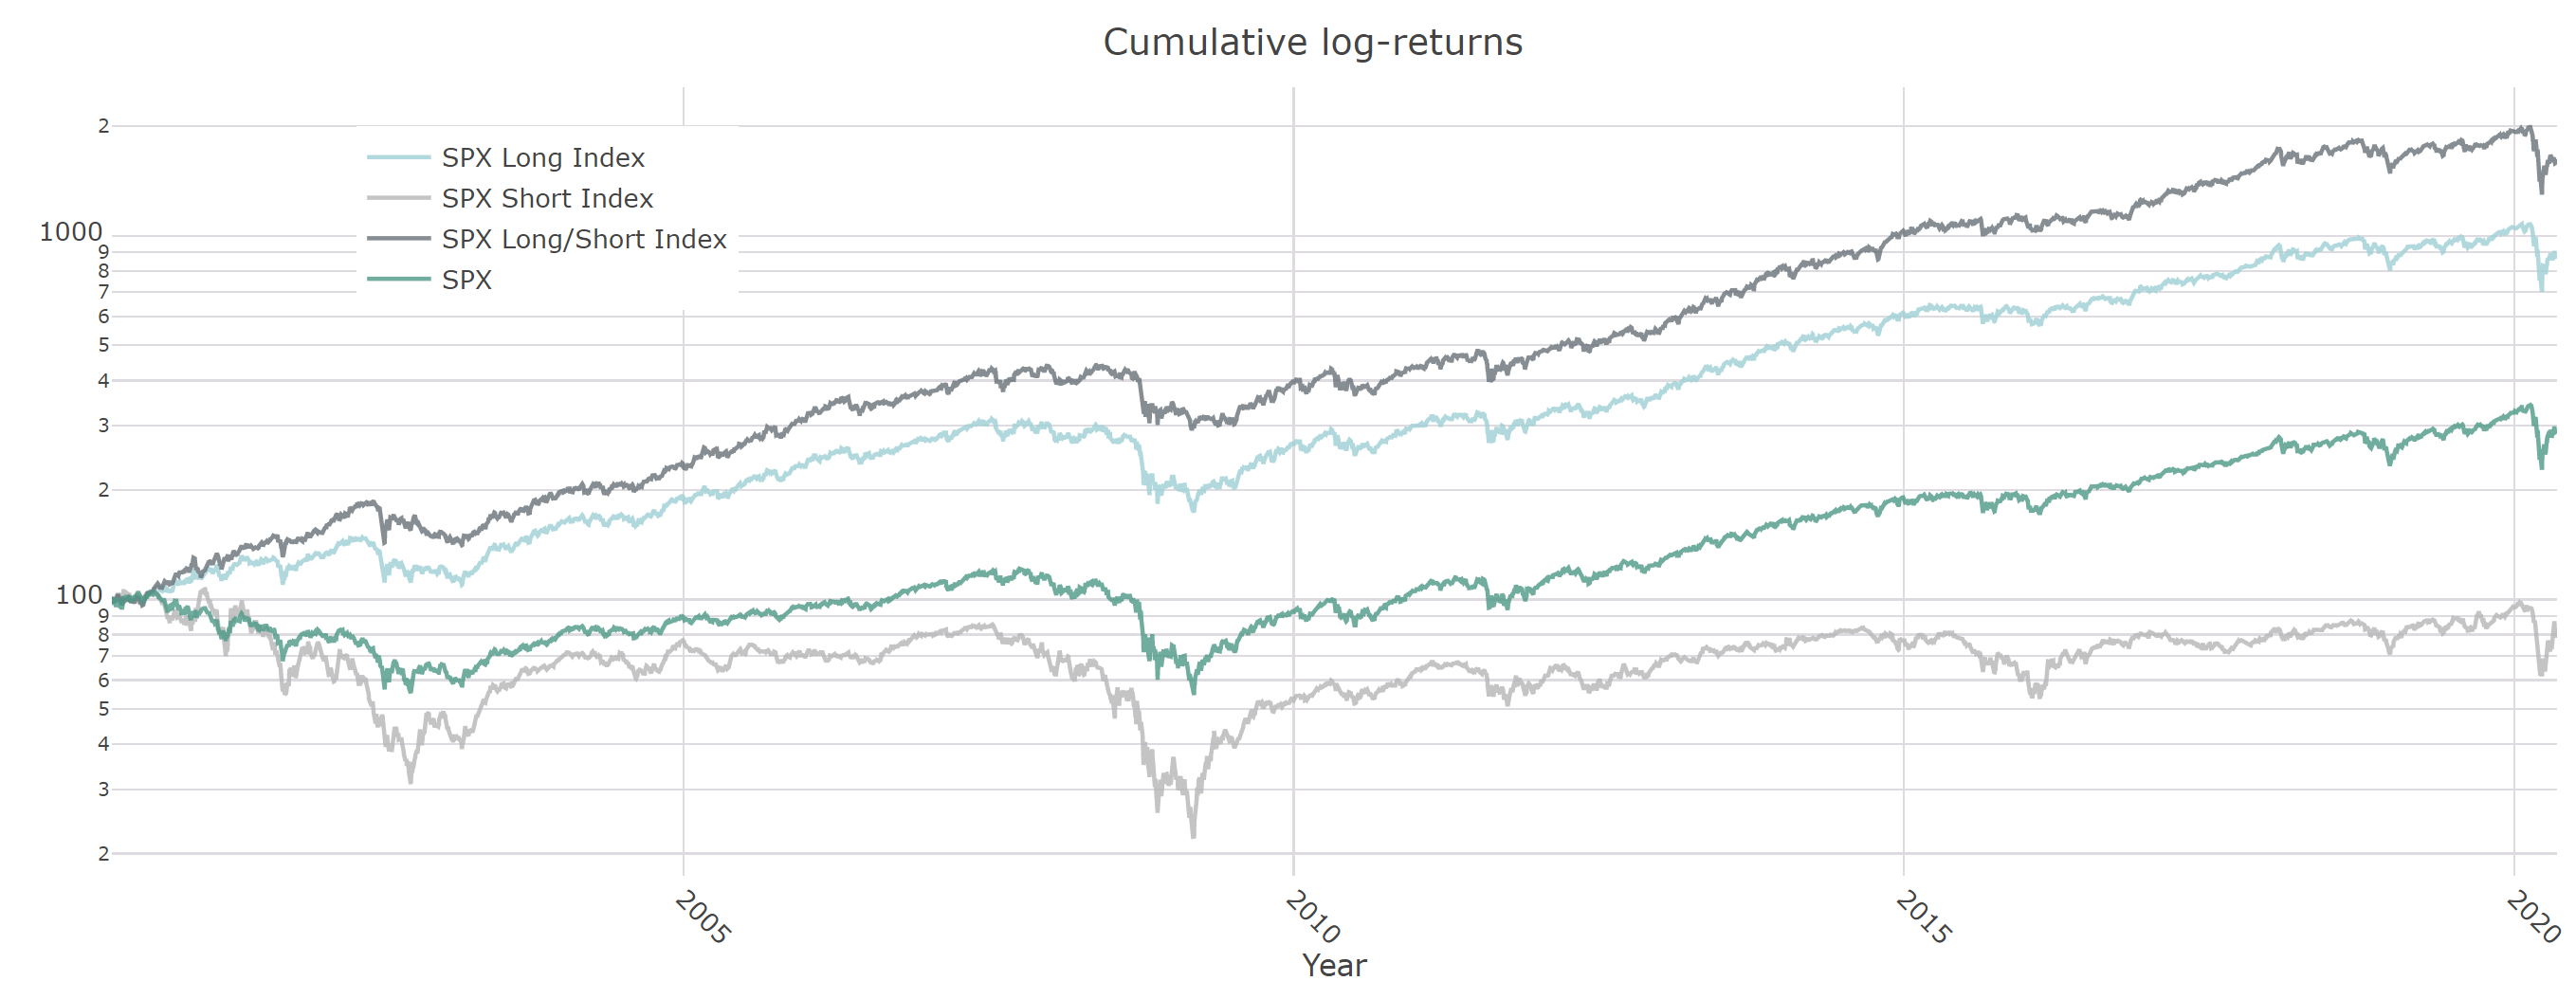
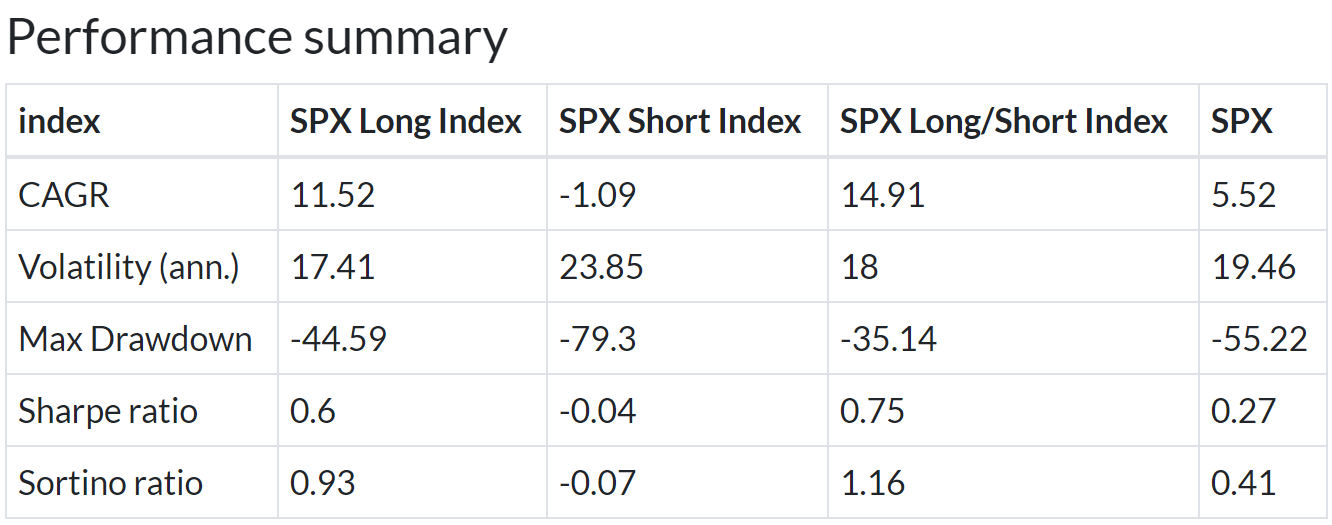
S&P 500
6% annualized outperformance with lower volatility and smaller drawdown for the long model and almost 10% outperformance for the 130/30 model.
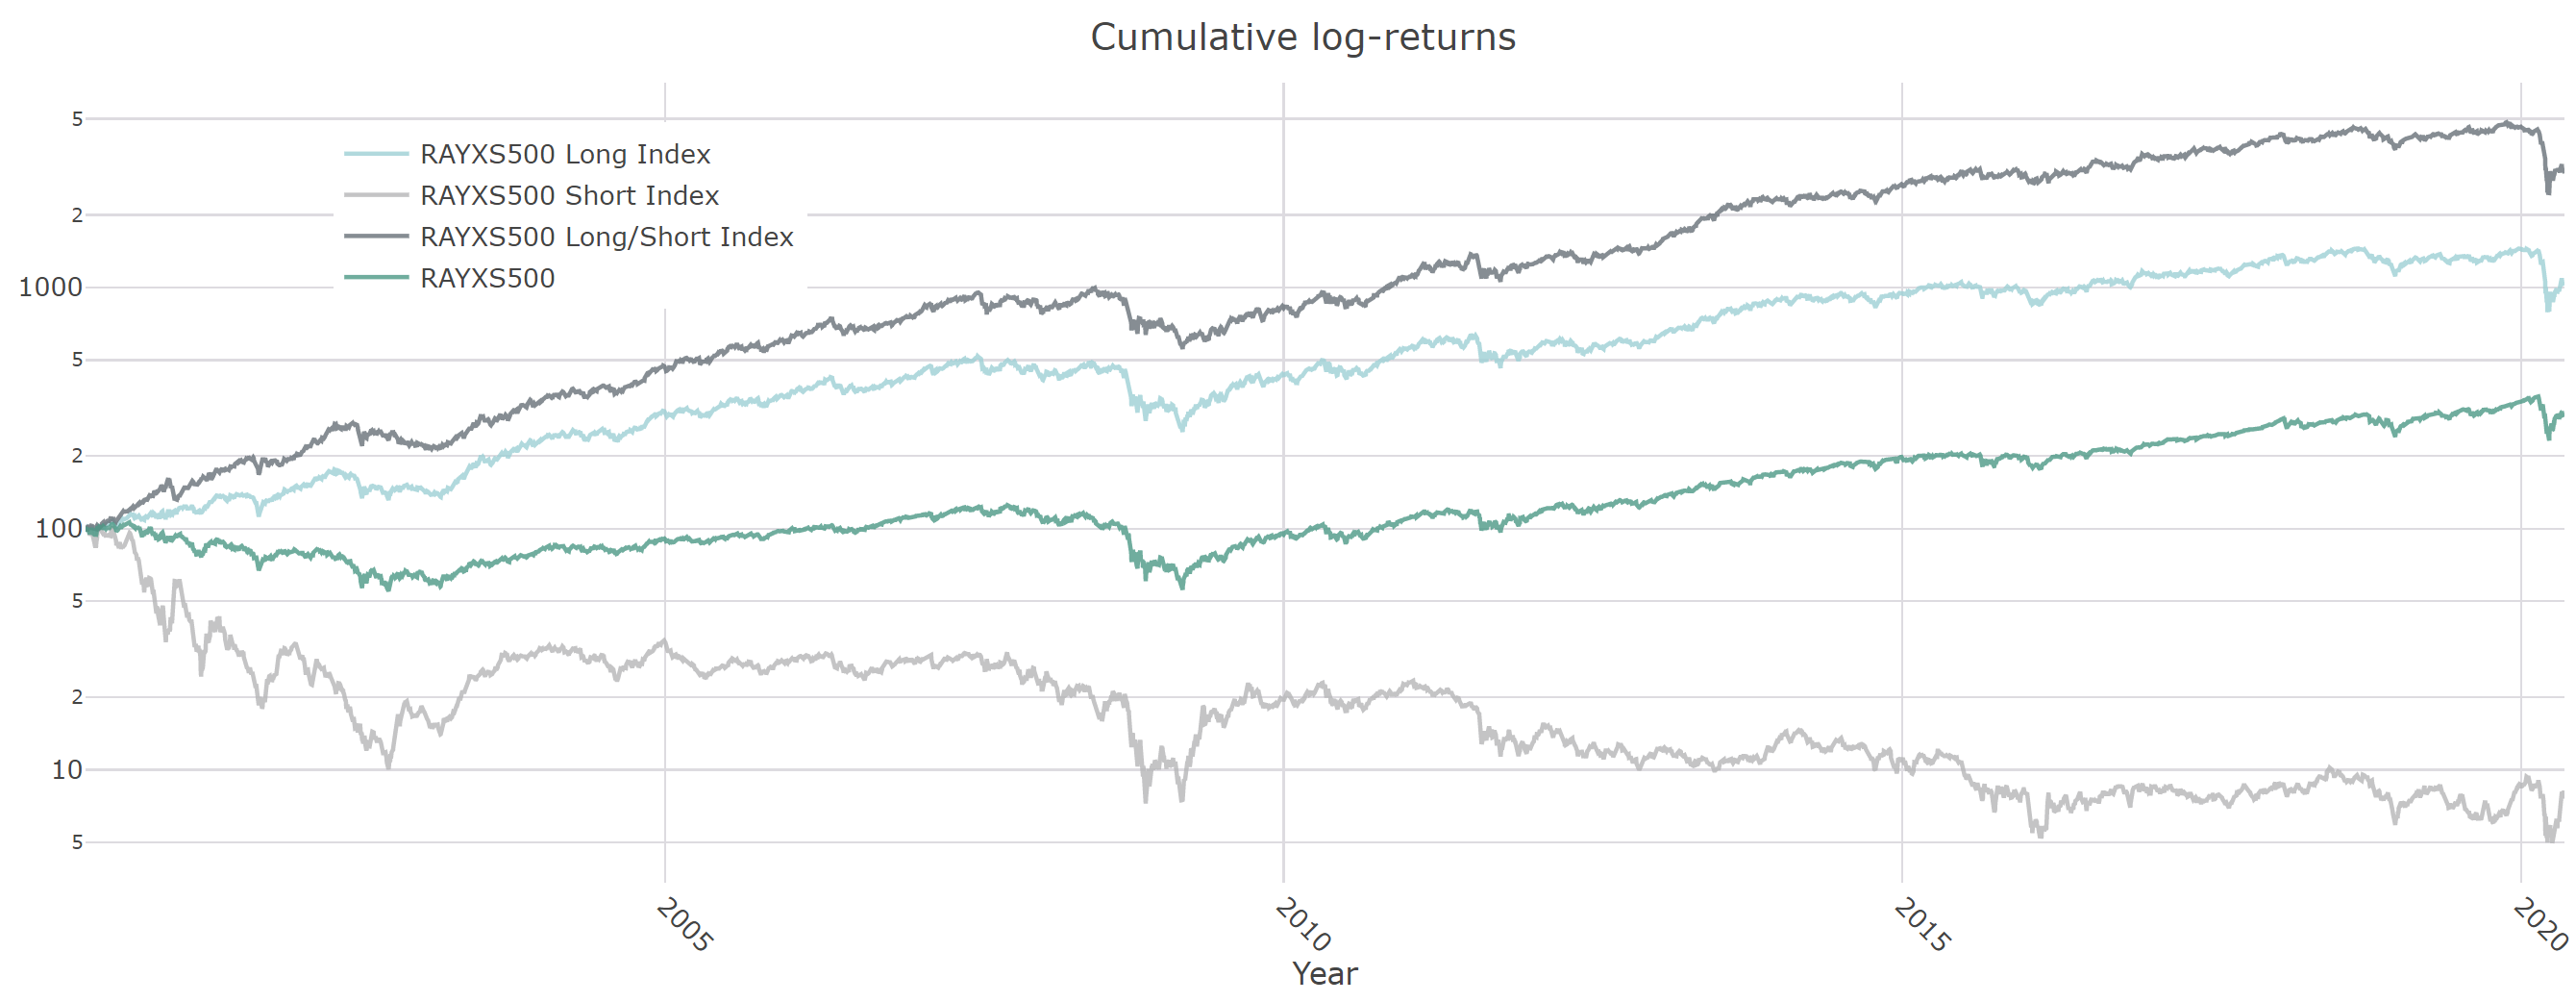
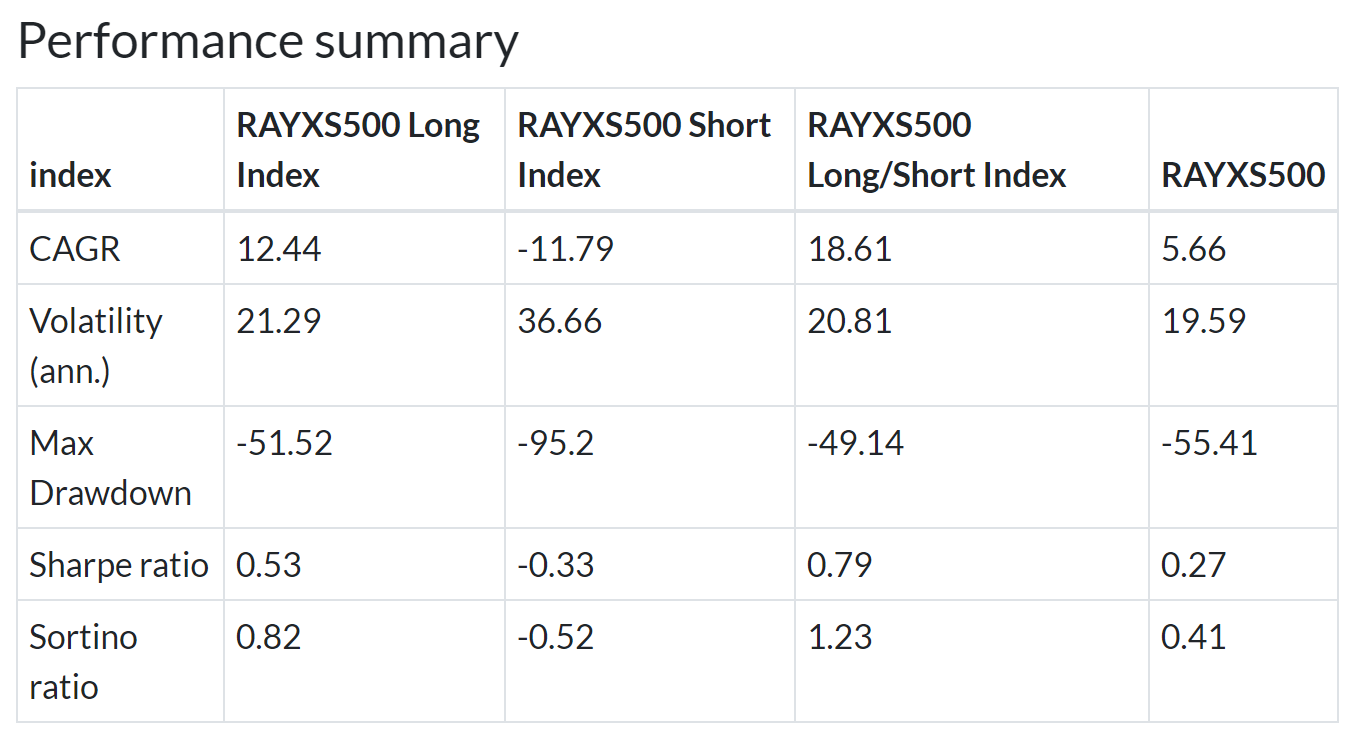
Russell 3000 without S&P 500 members
7% annualized outperformance with a slightly higher volatility and smaller drawdown for the long model and almost 13% outperformance for the 130/30 model.
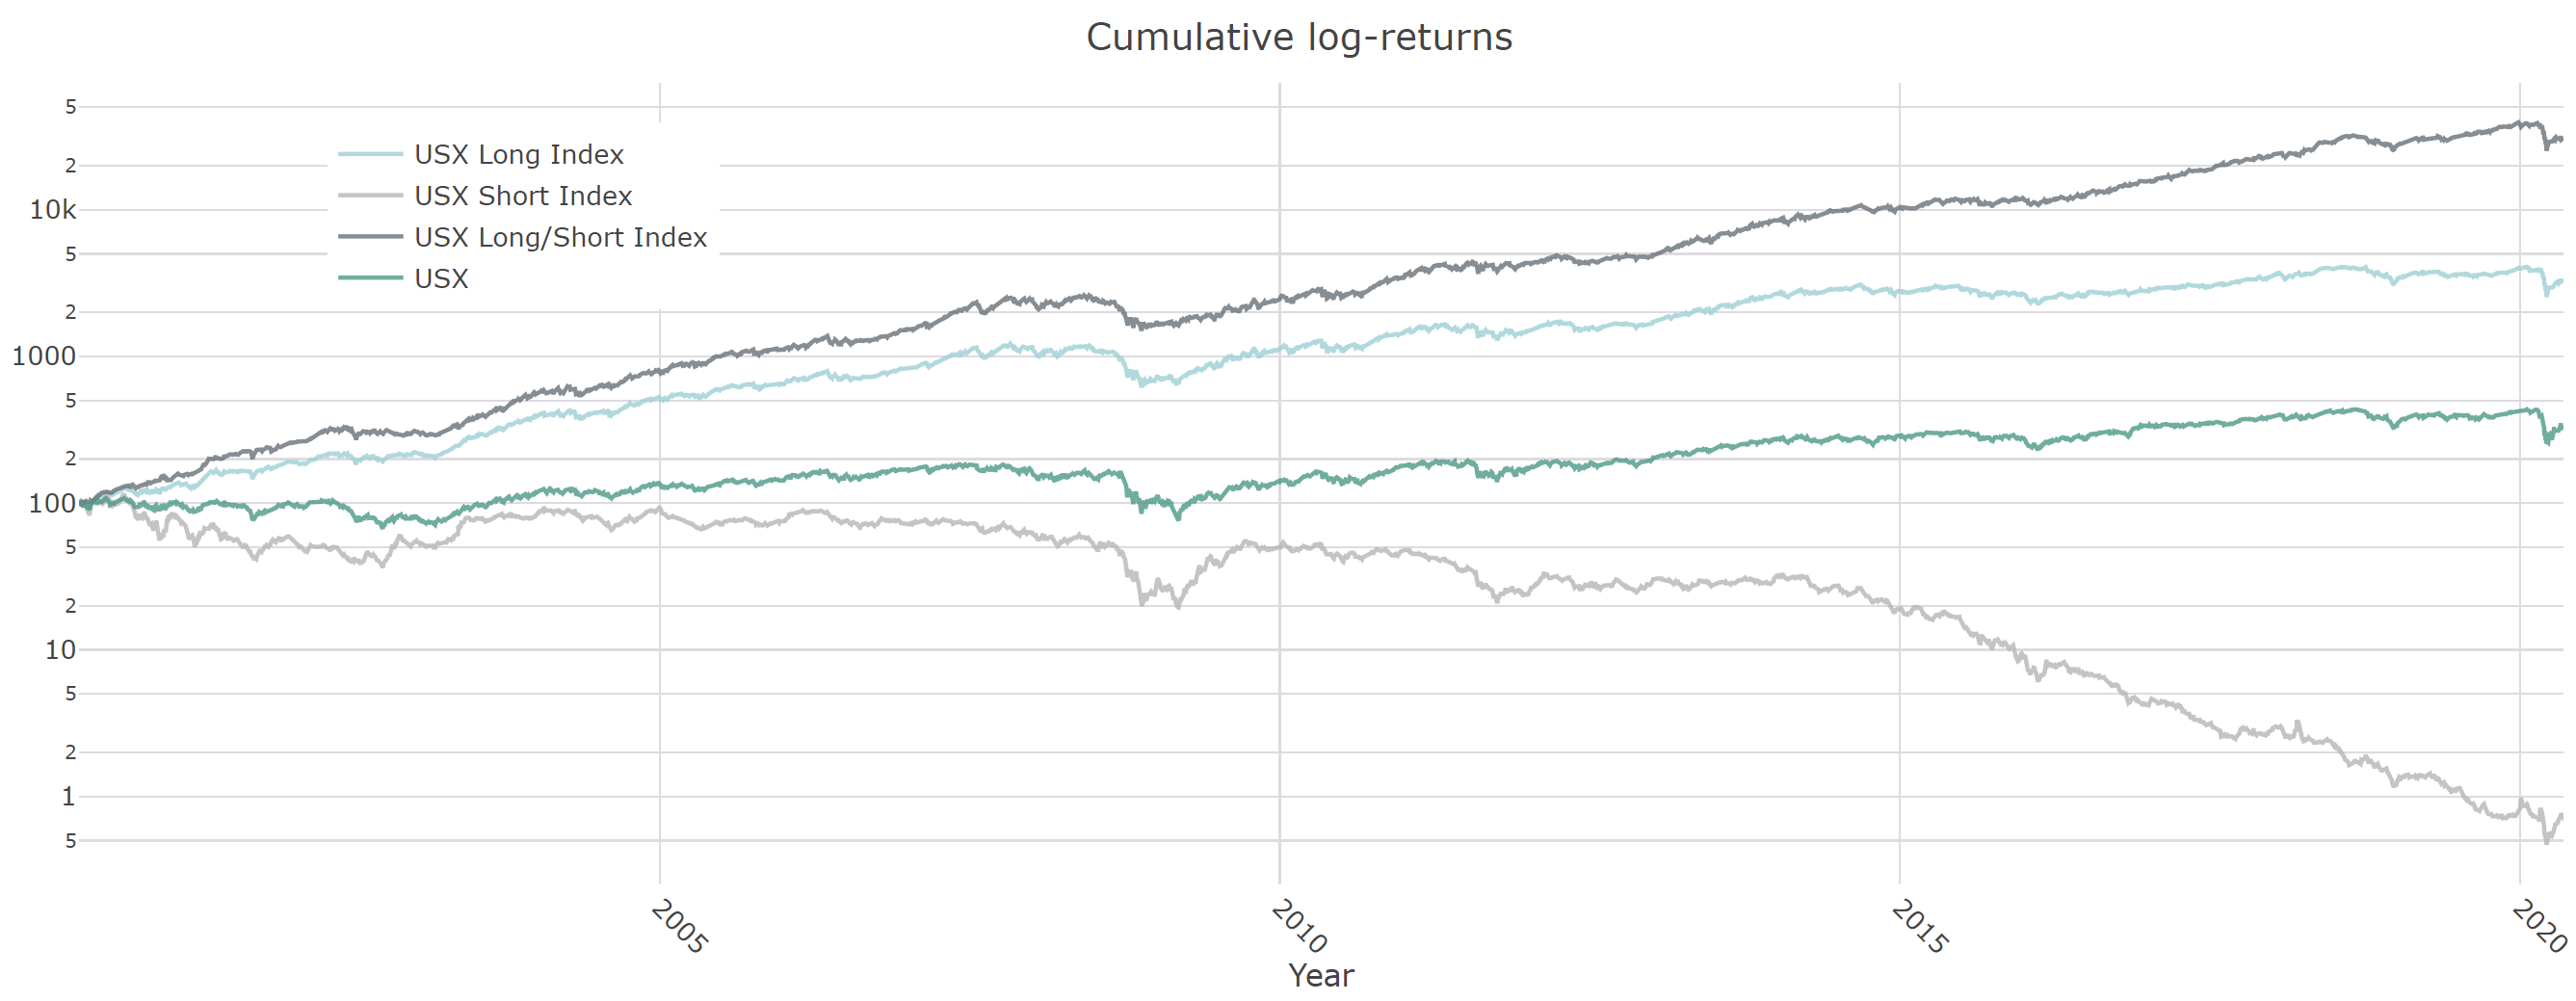
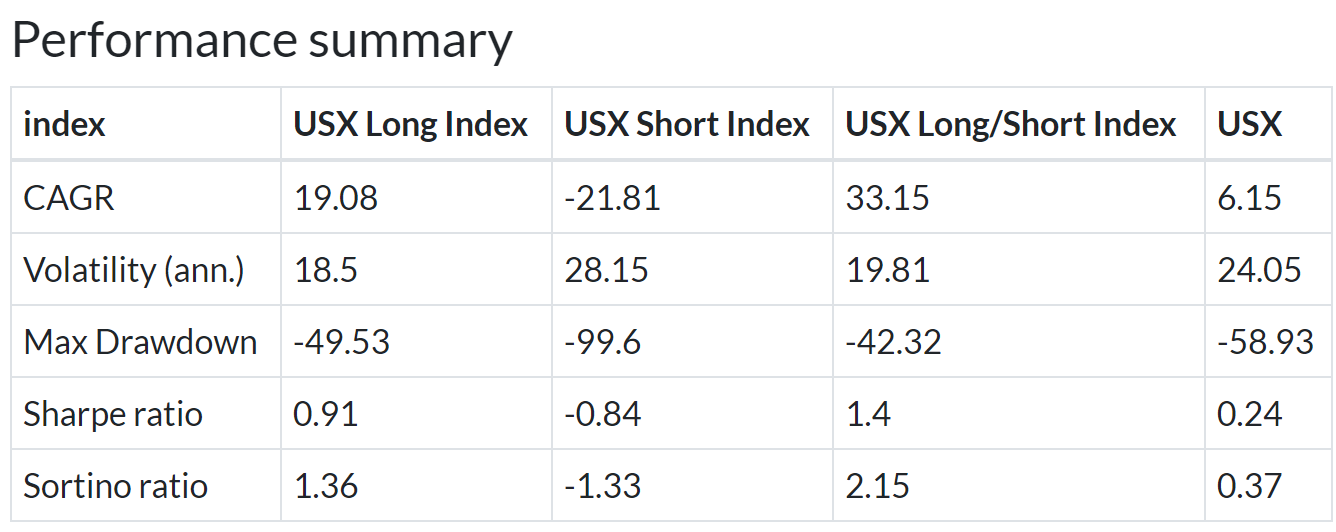
US without Russell 3000 Members
This customized index only consider stocks which are outside of the Russell 3000 and hence remove the problematic of passive hearding witnessed in other indices. Stocks idiosyncratic characteristics matter here.
13% annualized outperformance with lower volatility and smaller drawdown for the long model and almost 27% outperformance for the 130/30 model.
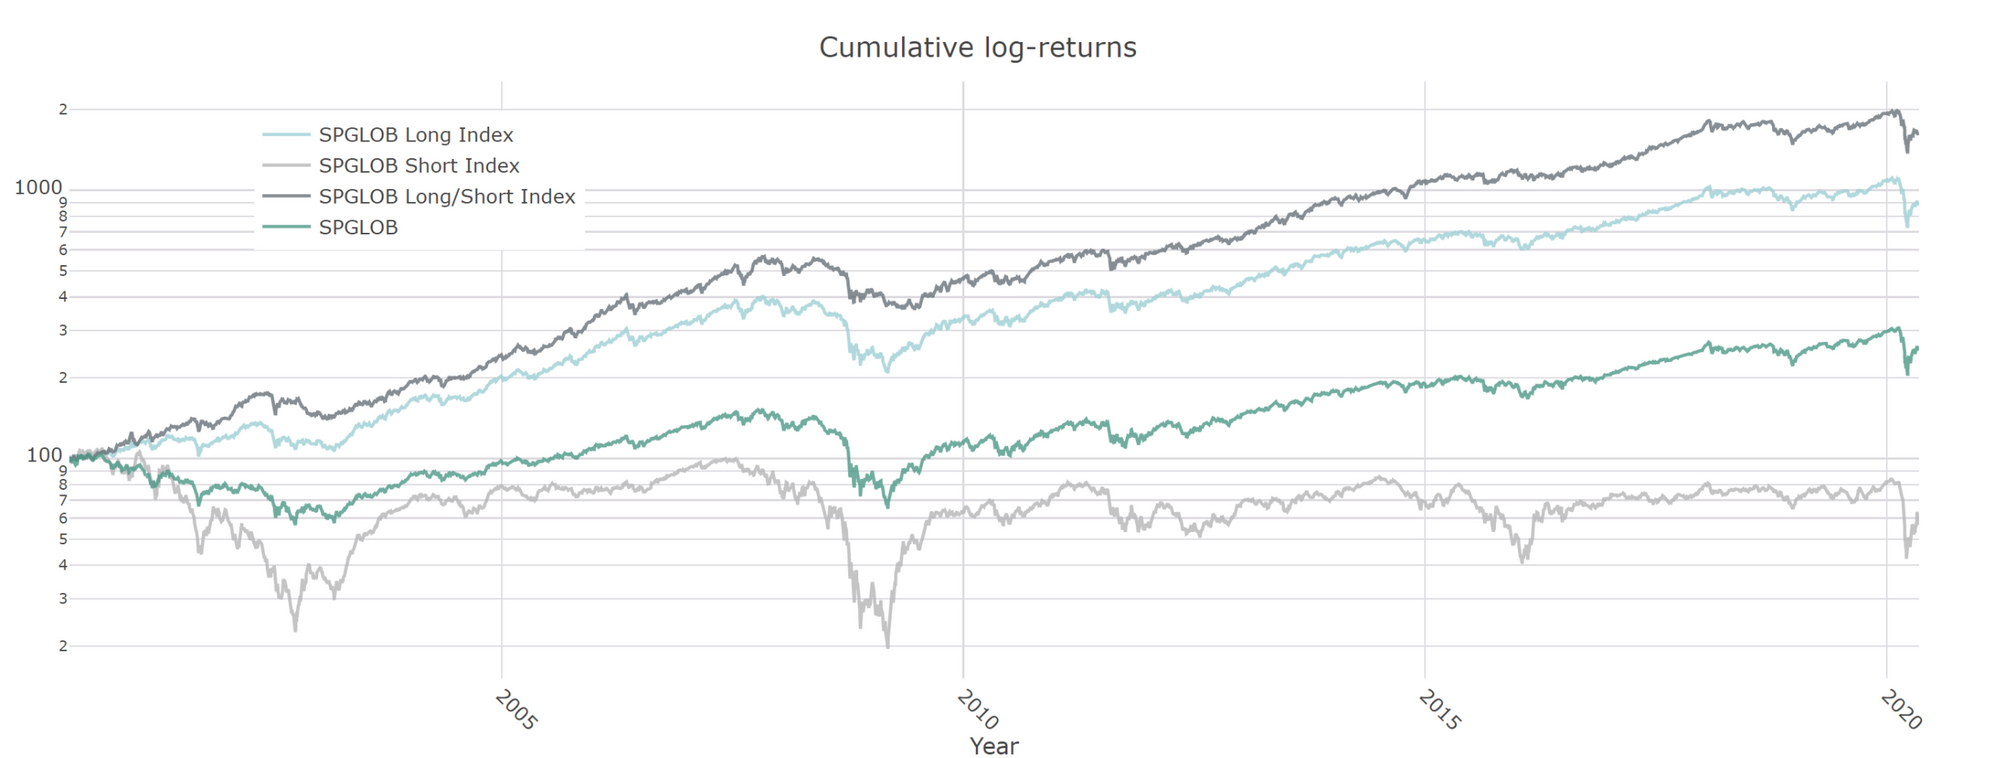
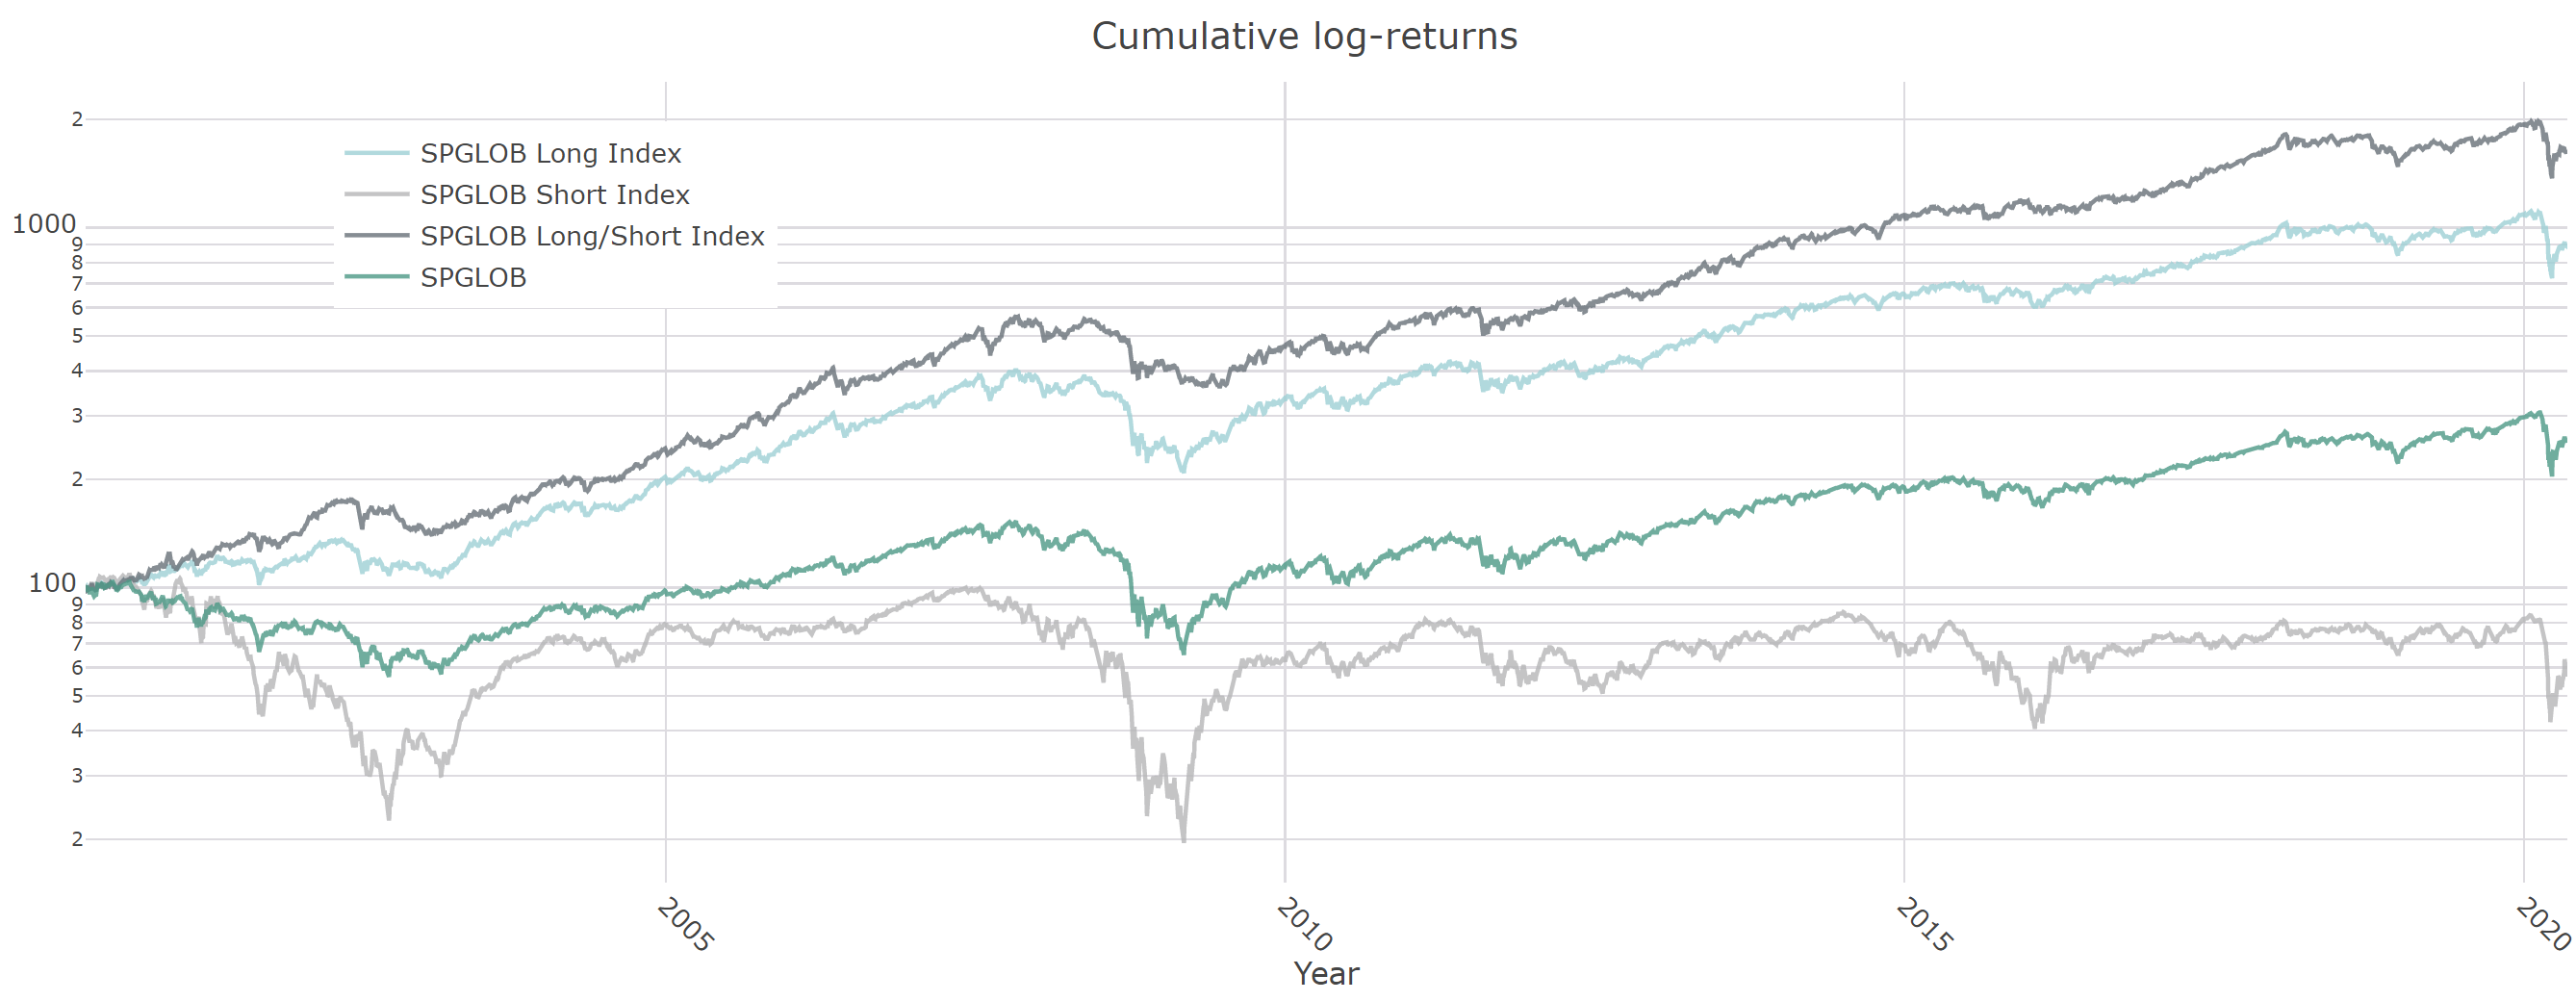
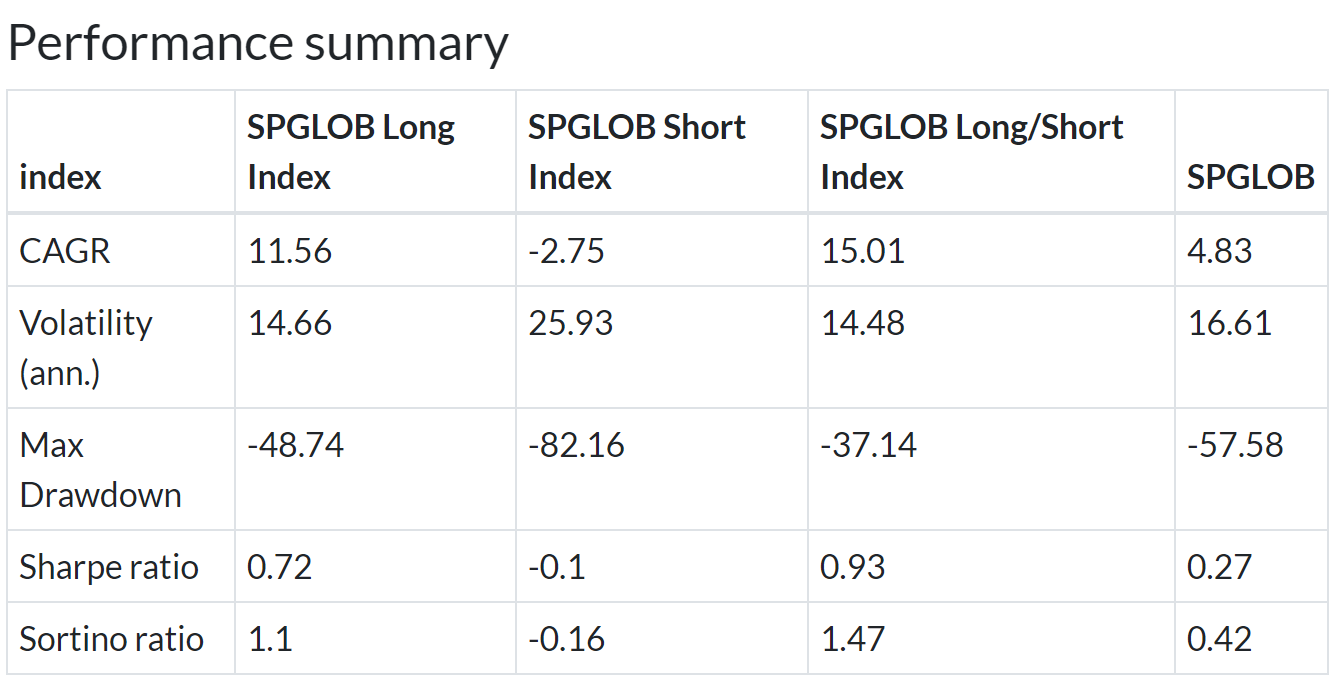
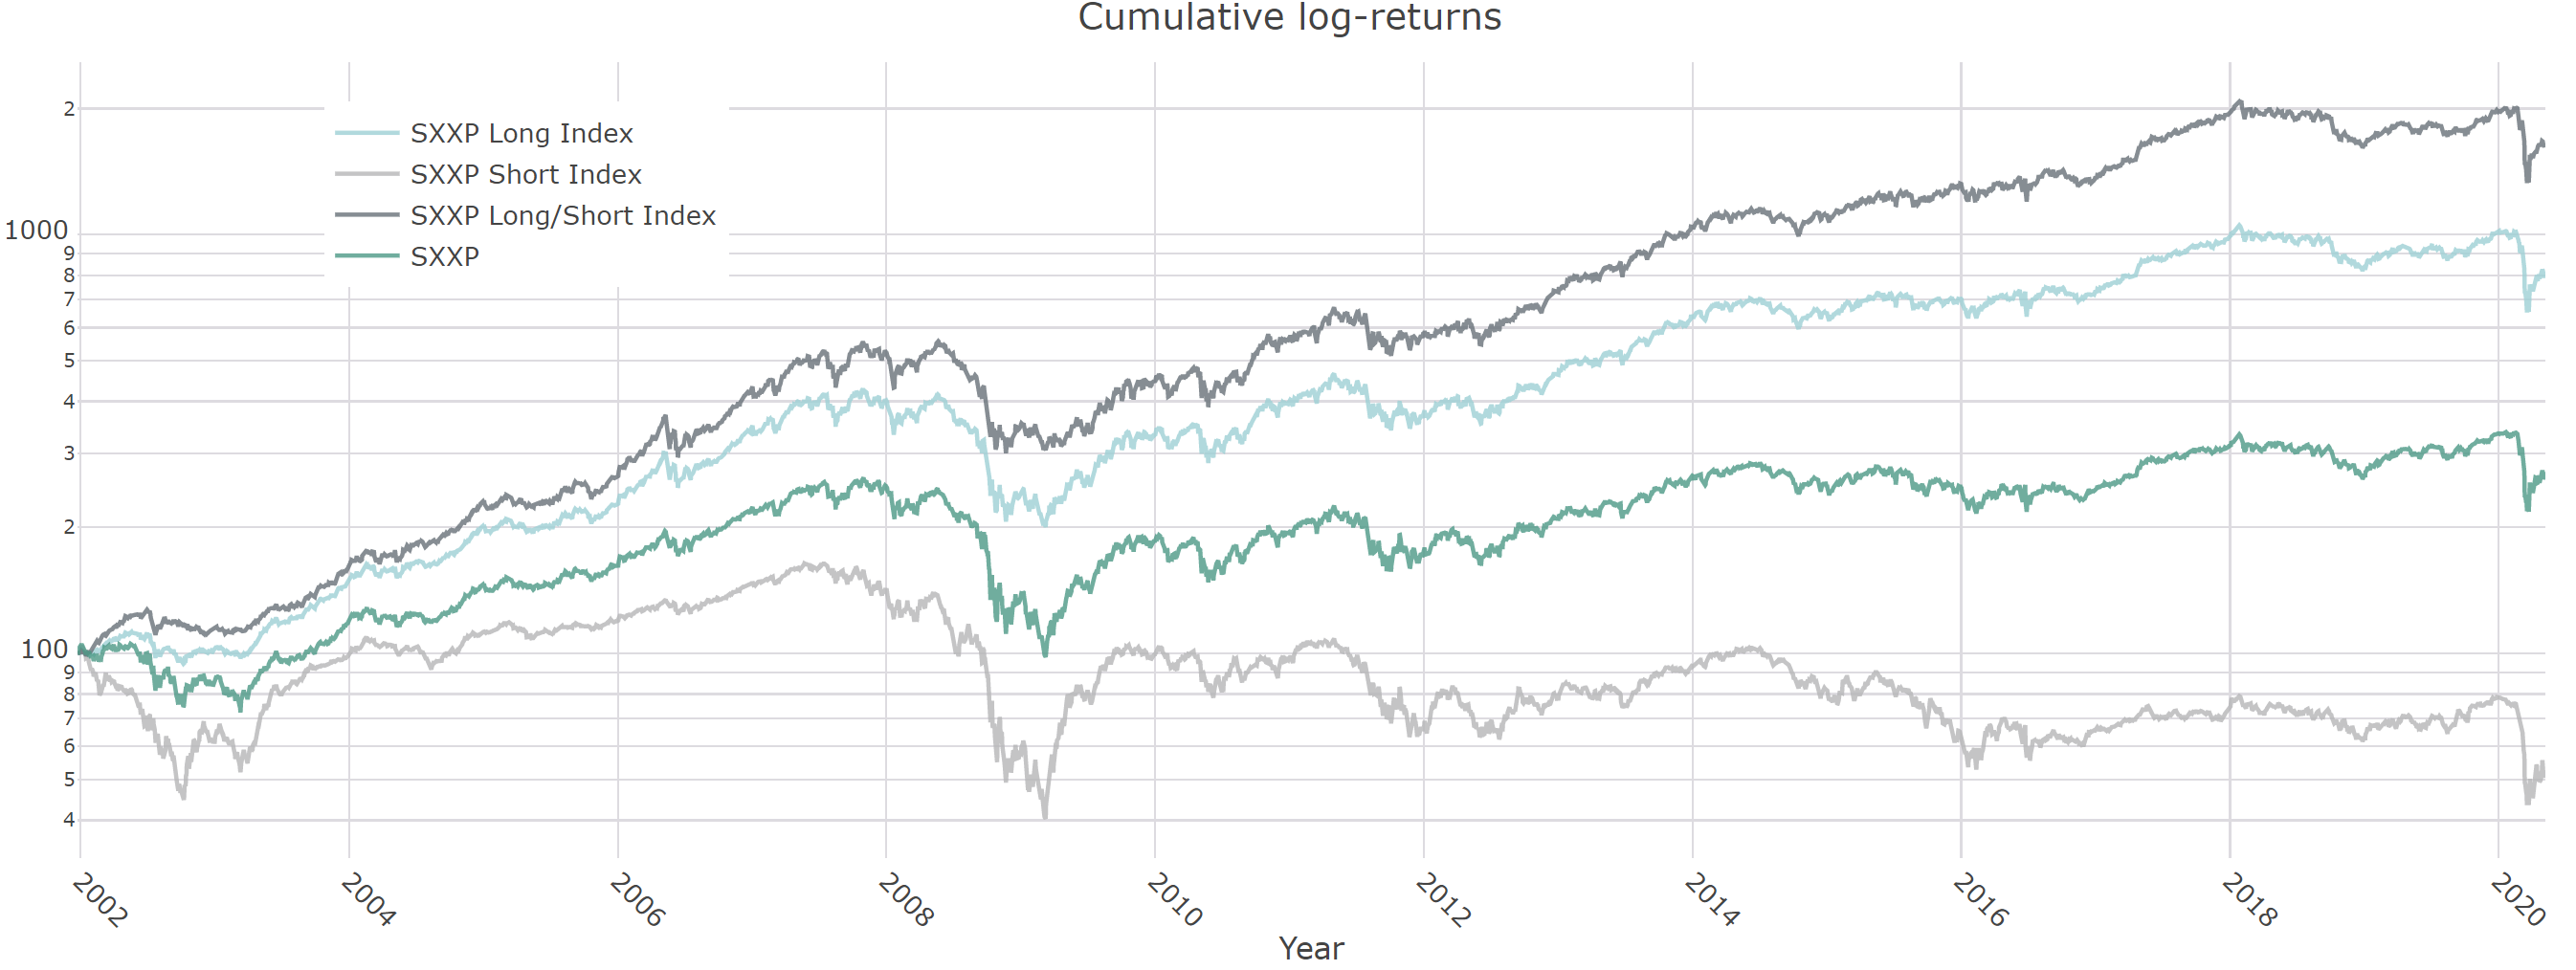
S&P Global 1200
7% annualized outperformance with lower volatility and smaller drawdown for the long model and 10% outperformance for the 130/30 model.
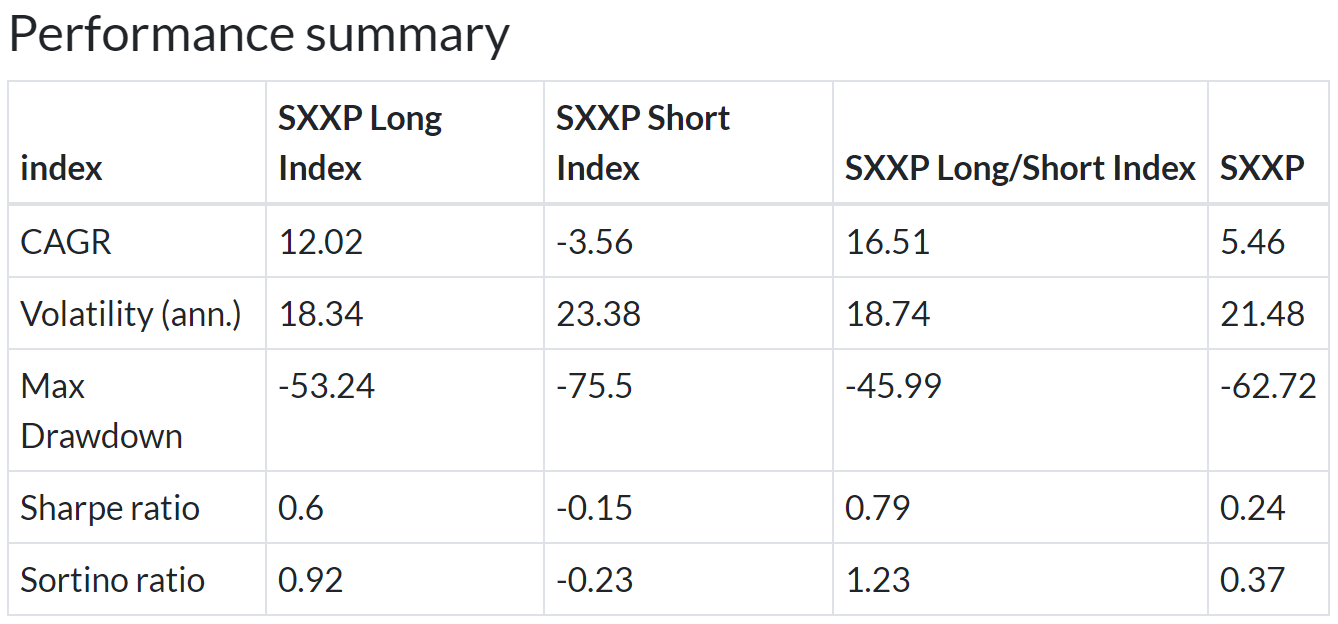
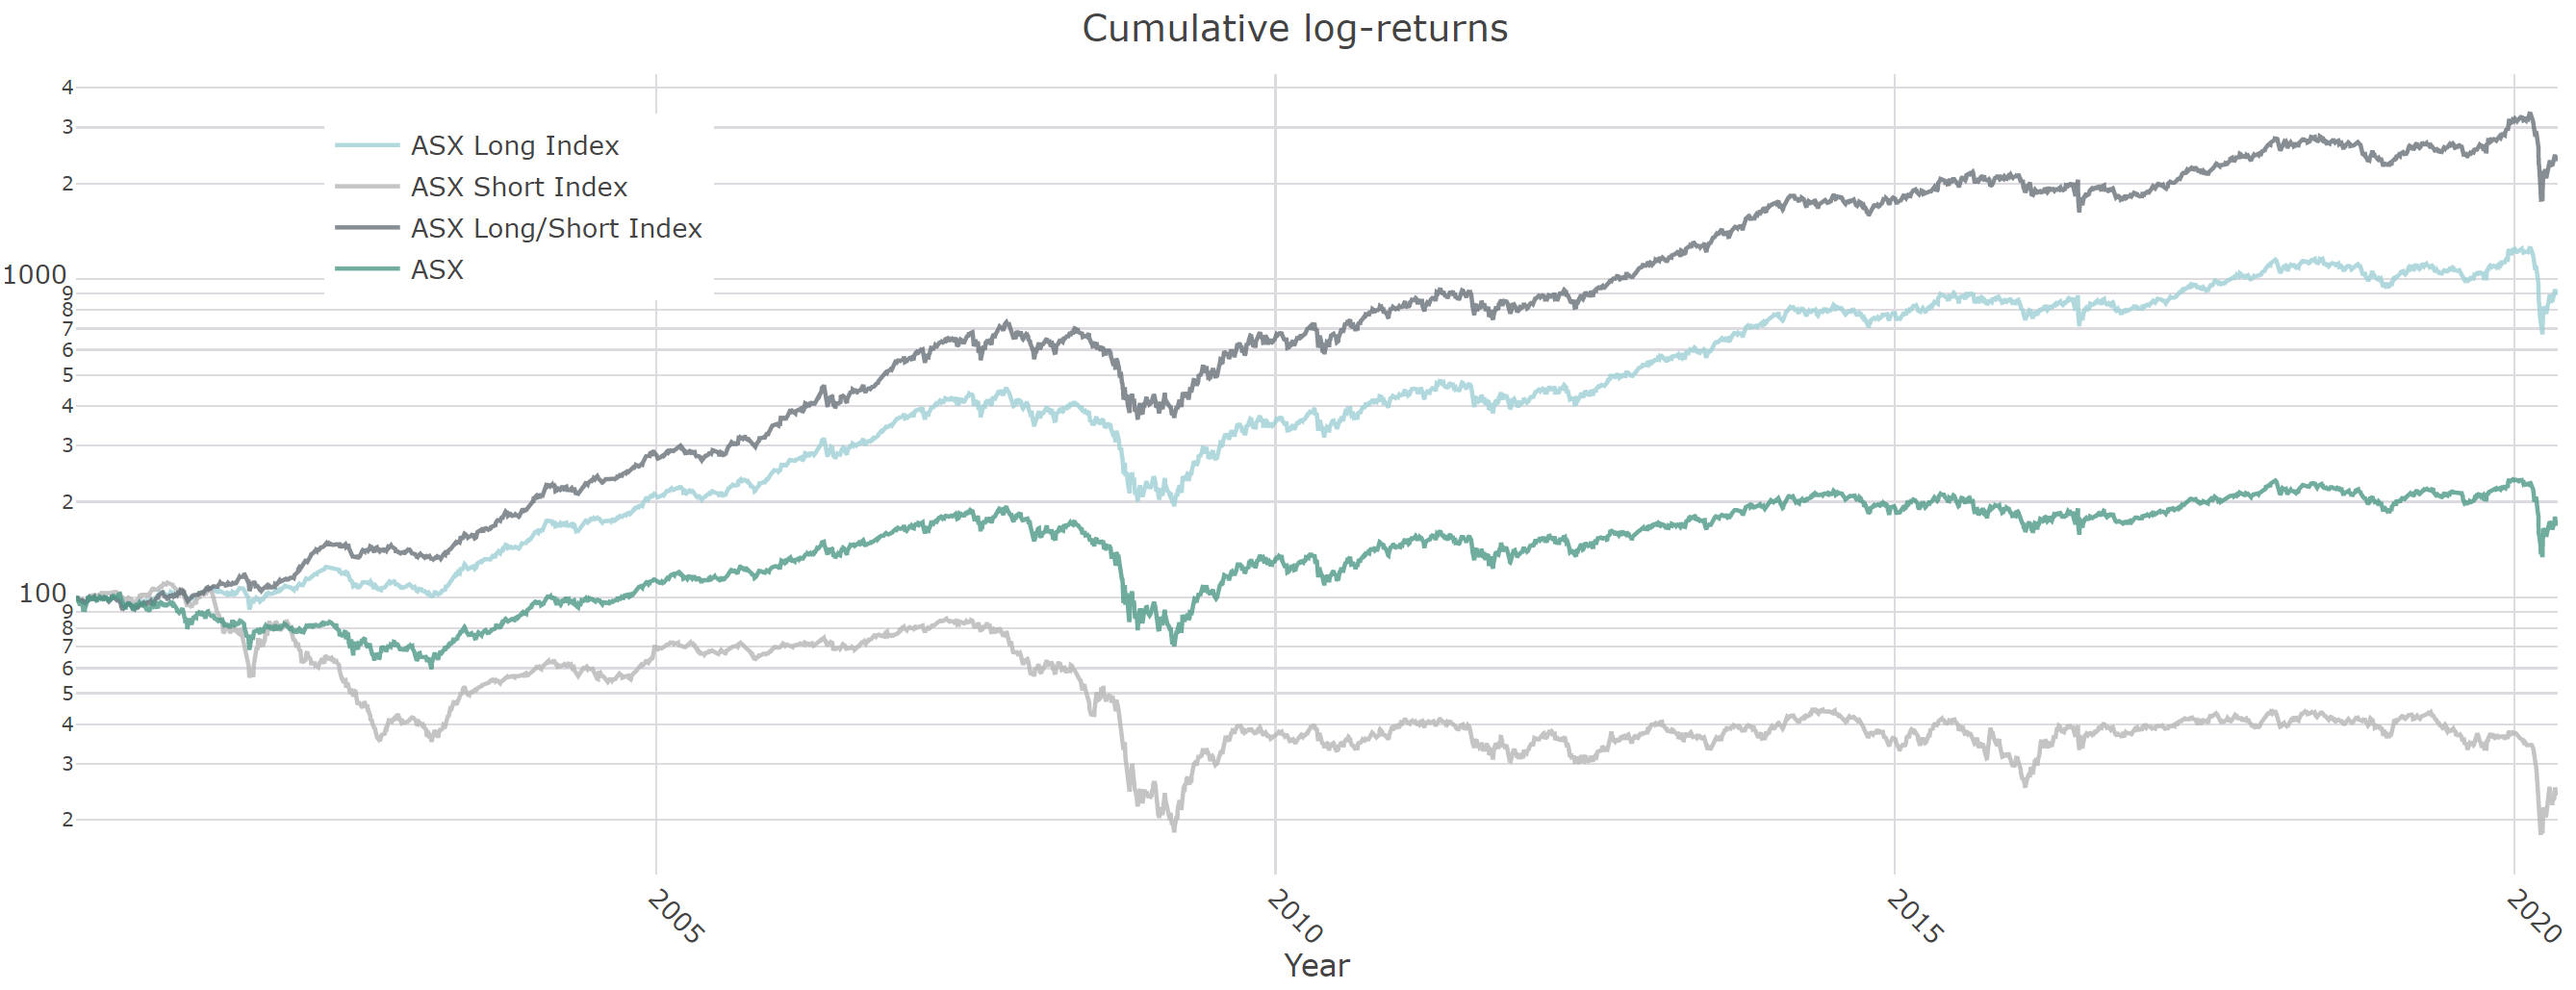
Stoxx Europe 600
7% annualized outperformance with lower volatility and smaller drawdown for the long model and 11% outperformance for the 130/30 model.
FTSE All-Share
9% annualized outperformance with lower volatility and smaller drawdown for the long model and almost 15% outperformance for the 130/30 model.
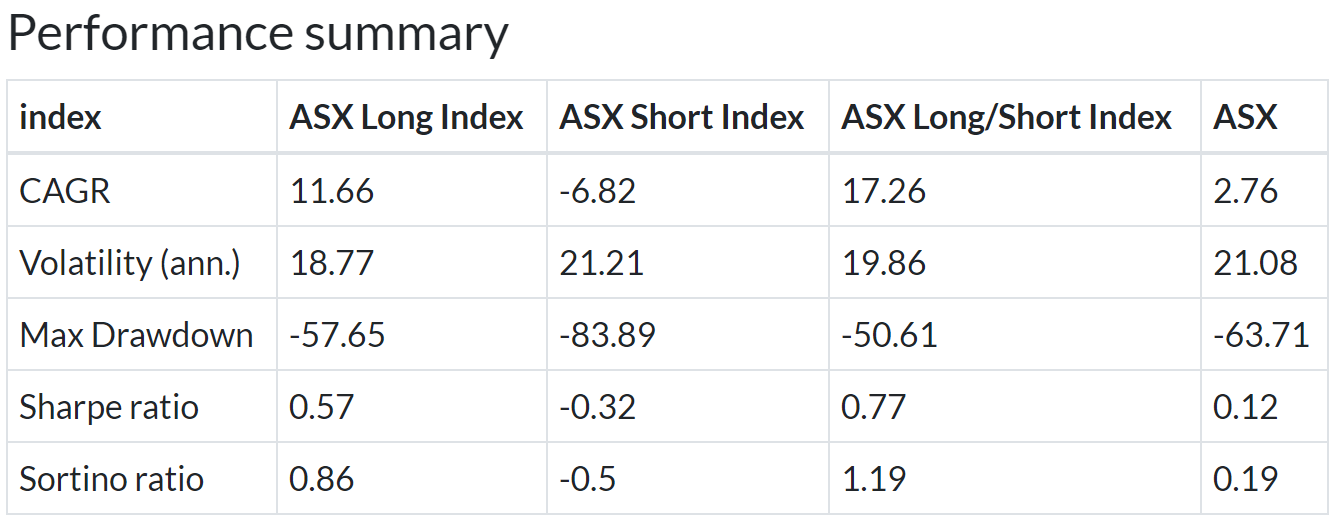
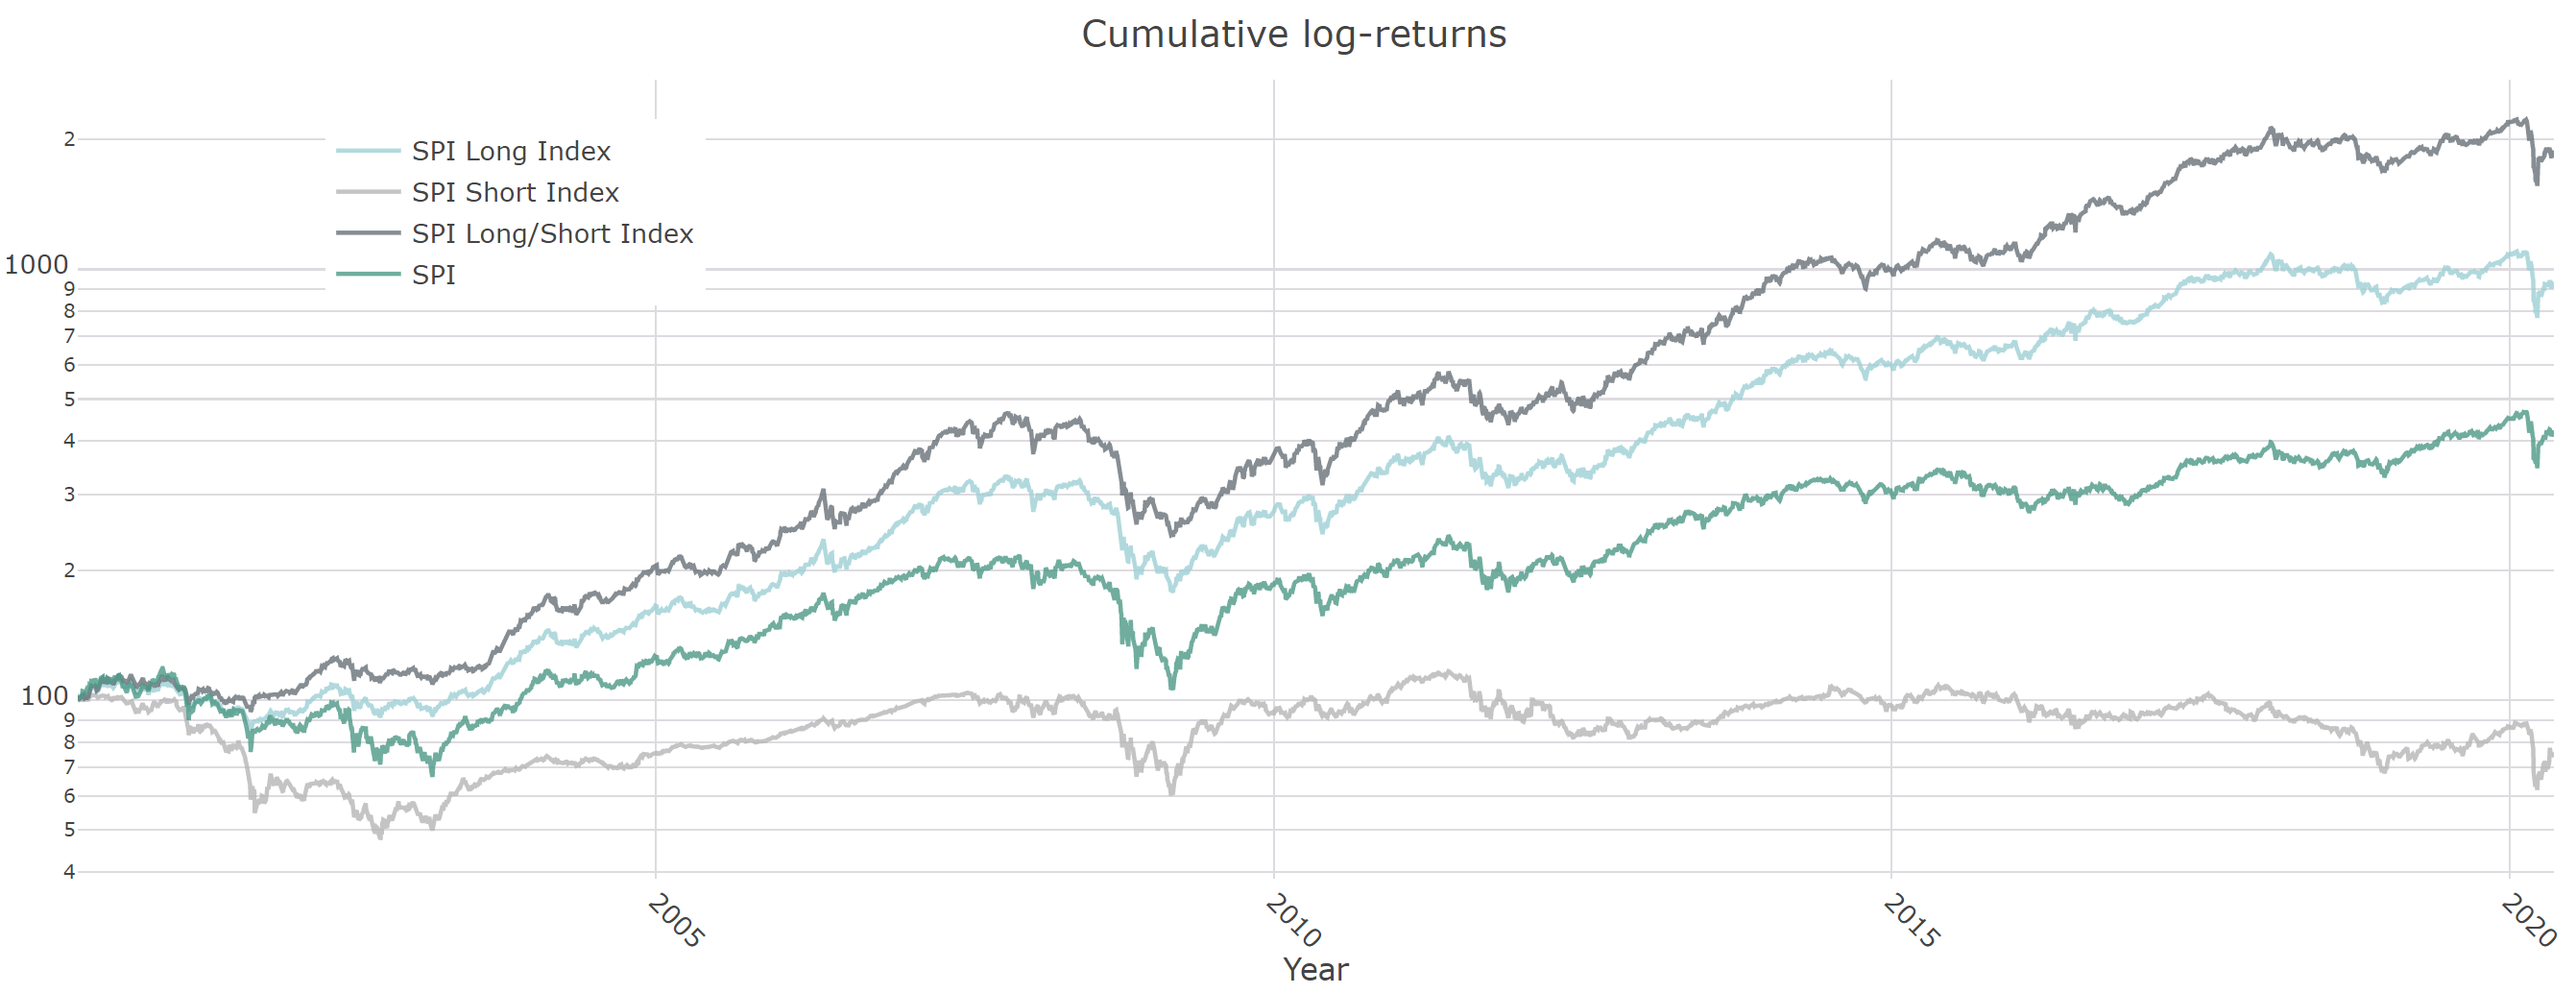
Swiss Performance Index
4% annualized outperformance with lower volatility and smaller drawdown for the long model and almost 8% outperformance for the 130/30 model.
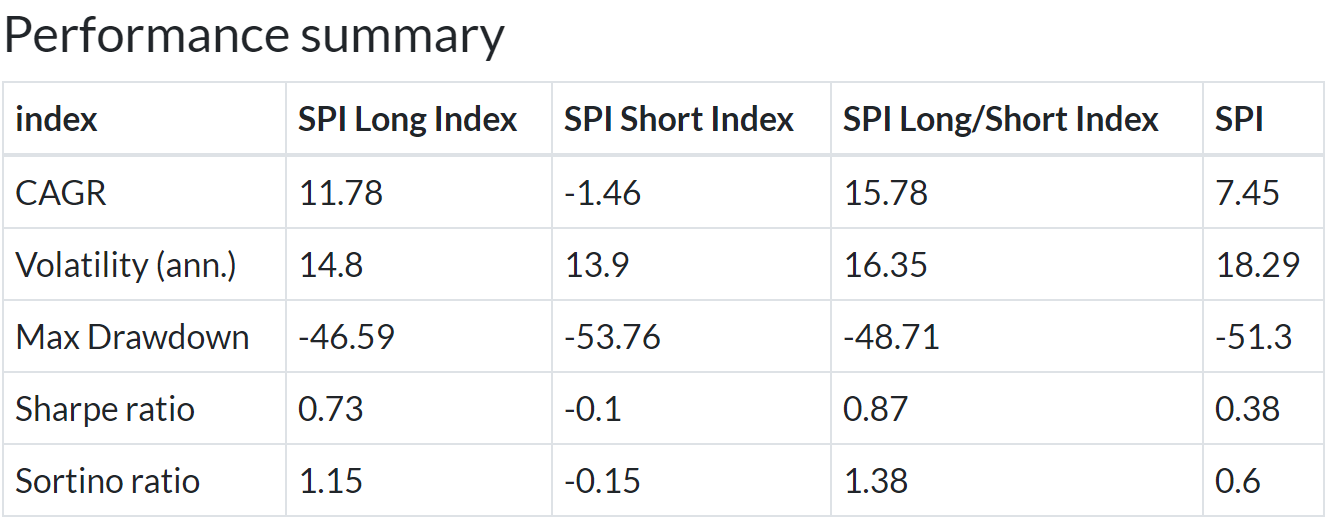
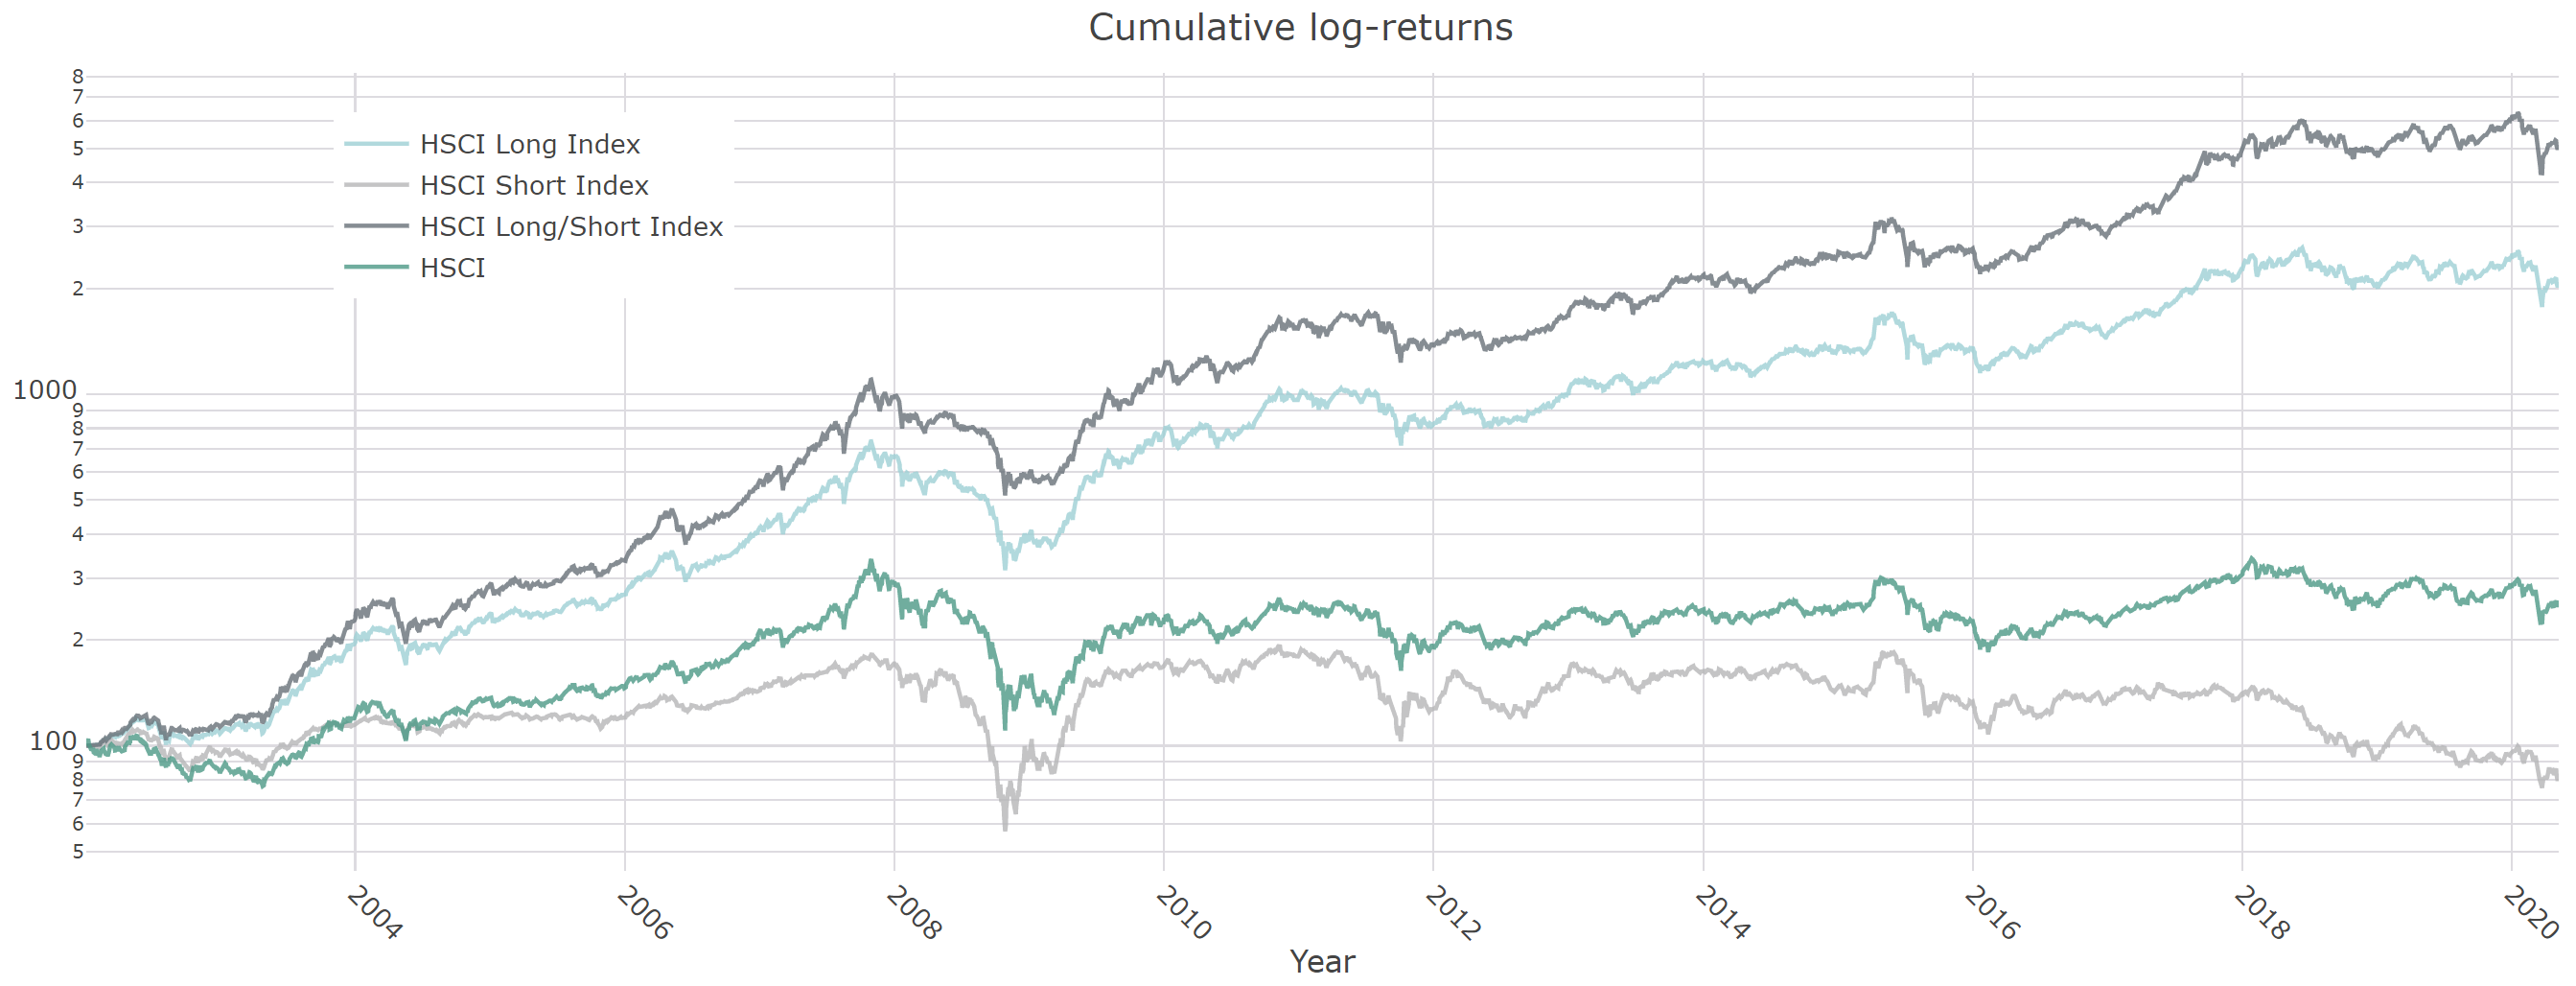
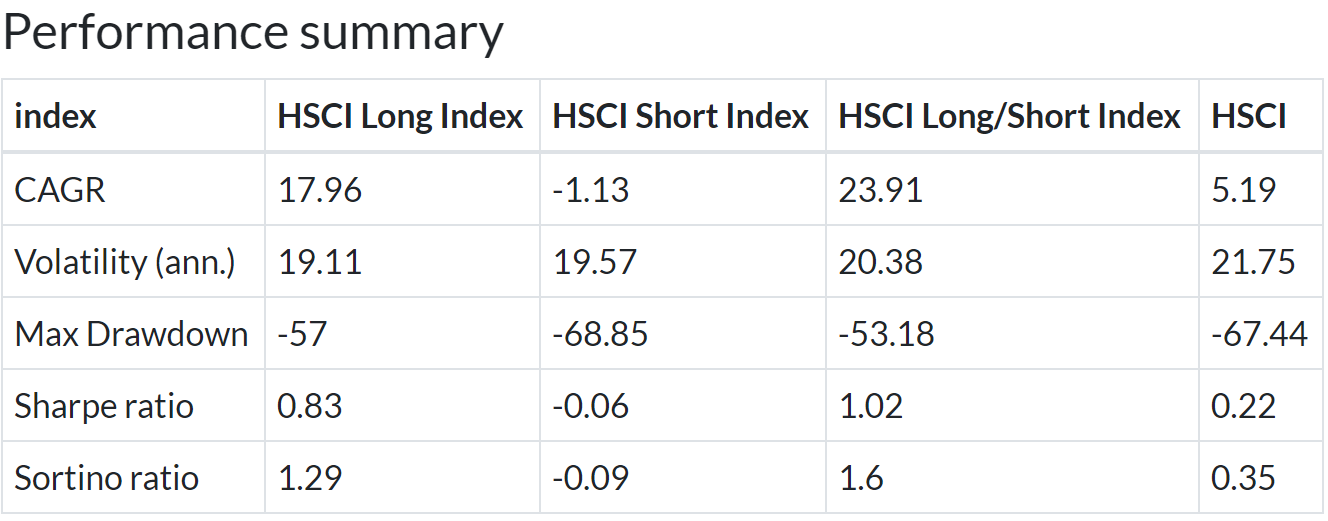
Hang Seng Composite
13% annualized outperformance with lower volatility and smaller drawdown for the long model and almost 19% outperformance for the 130/30 model.
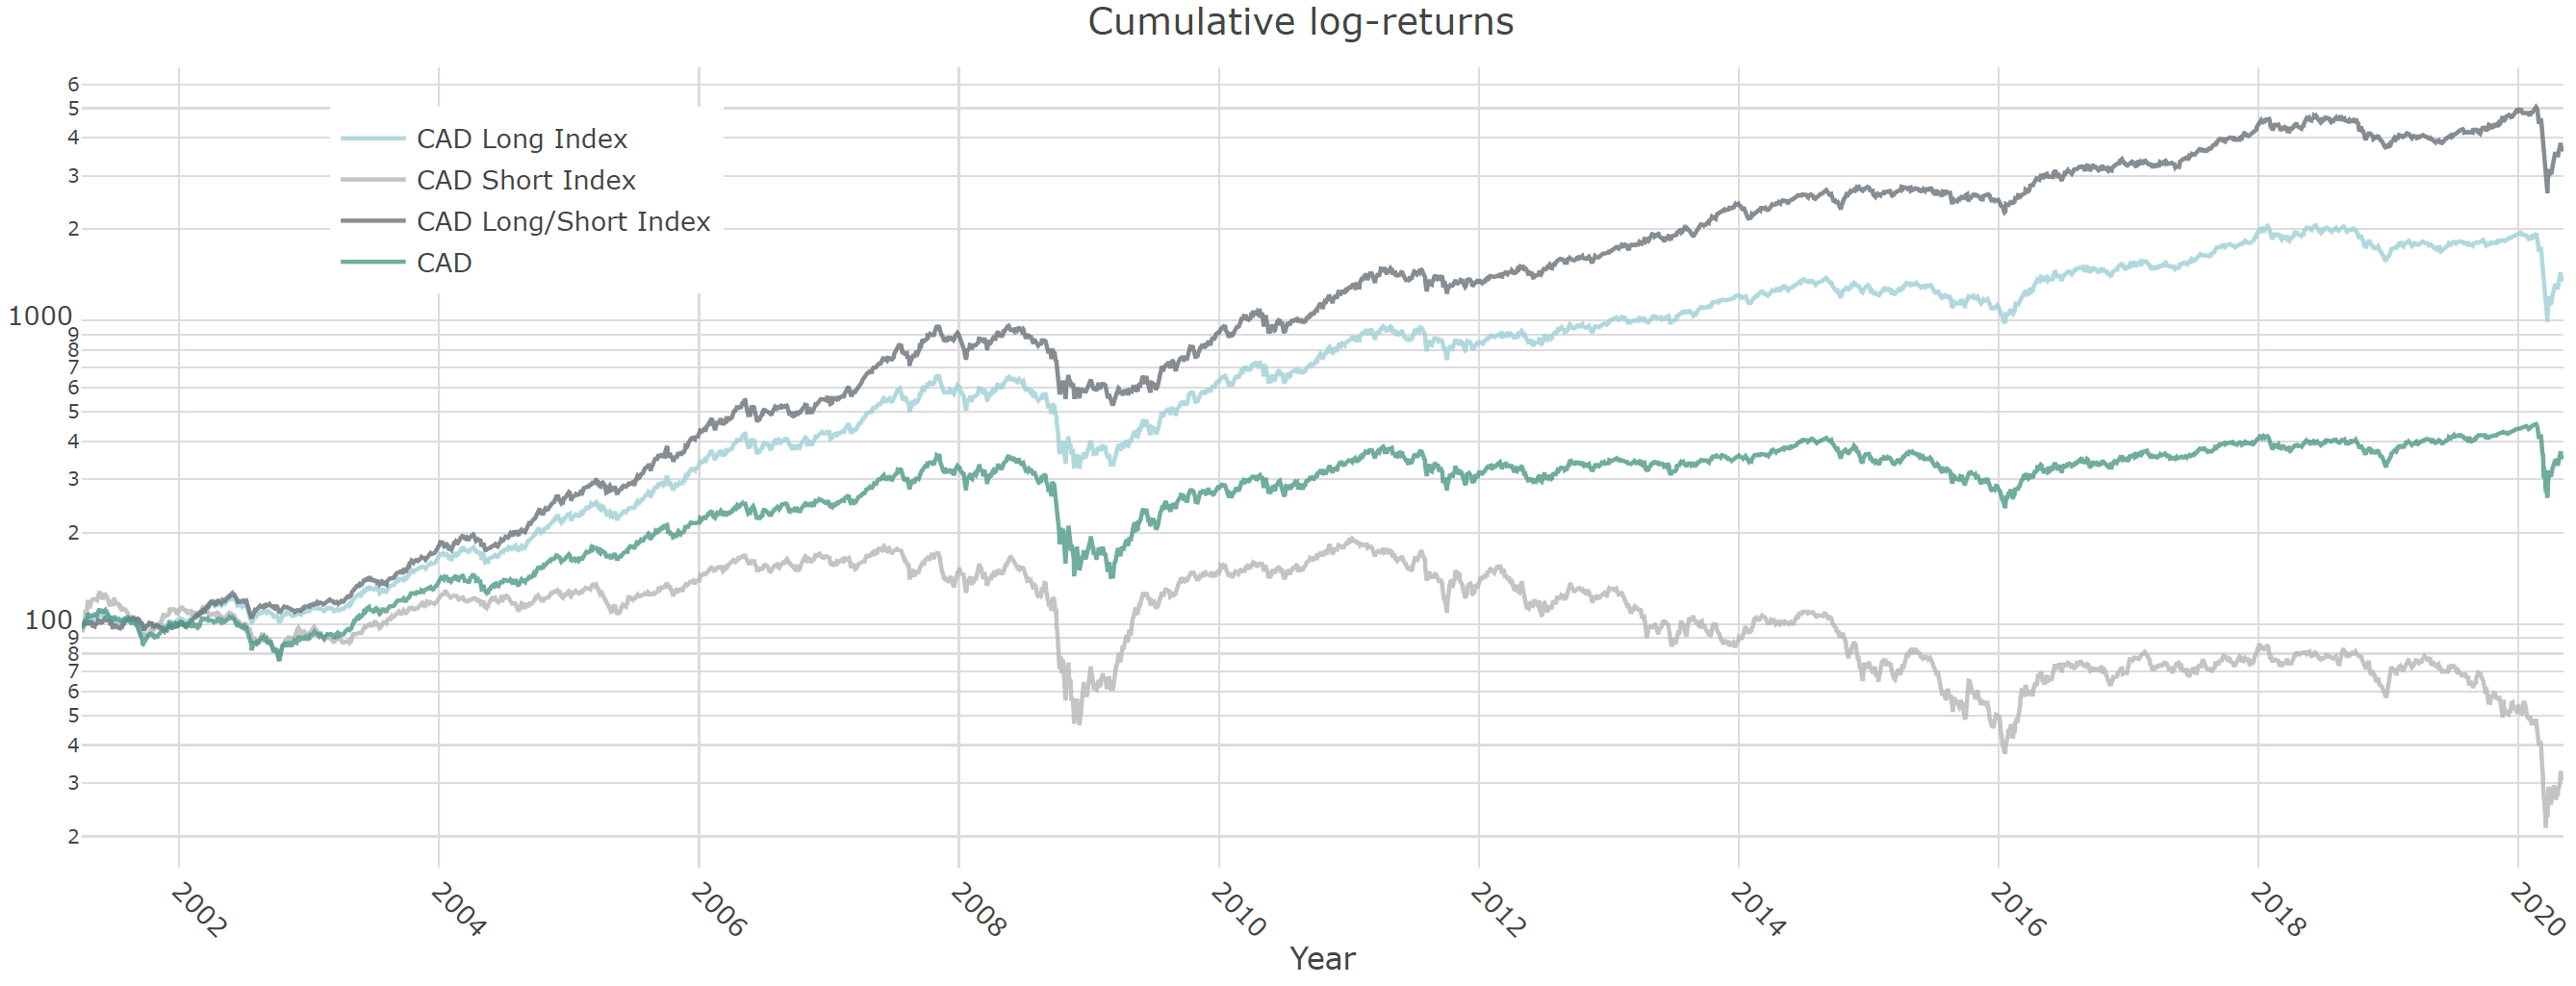
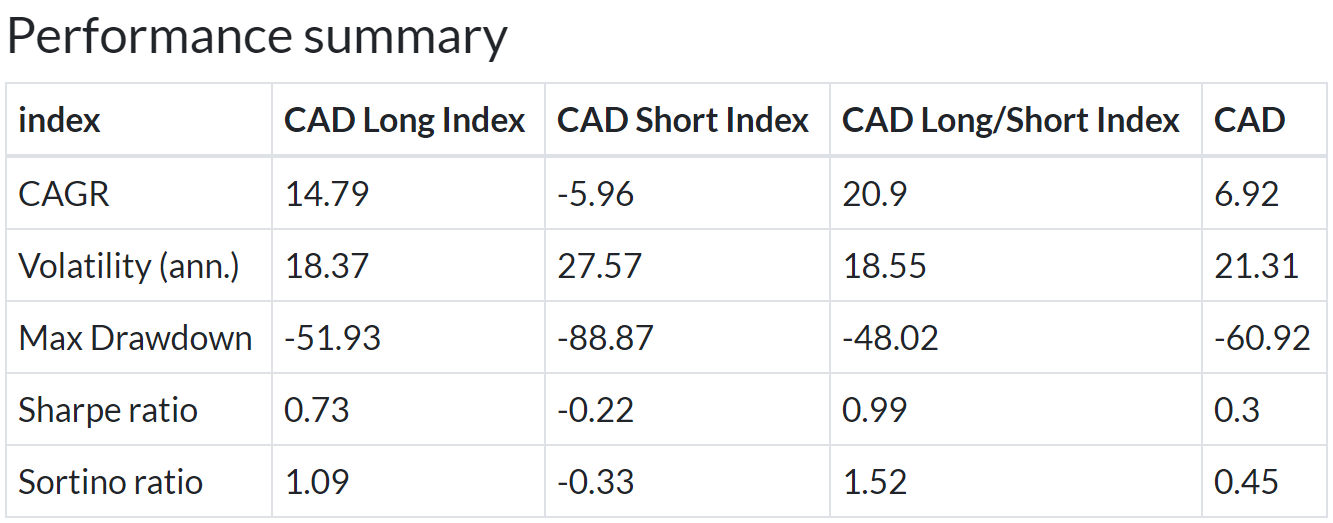
S&P/TSX Composite
8% annualized outperformance with lower volatility and smaller drawdown for the long model and almost 14% outperformance for the 130/30 model.
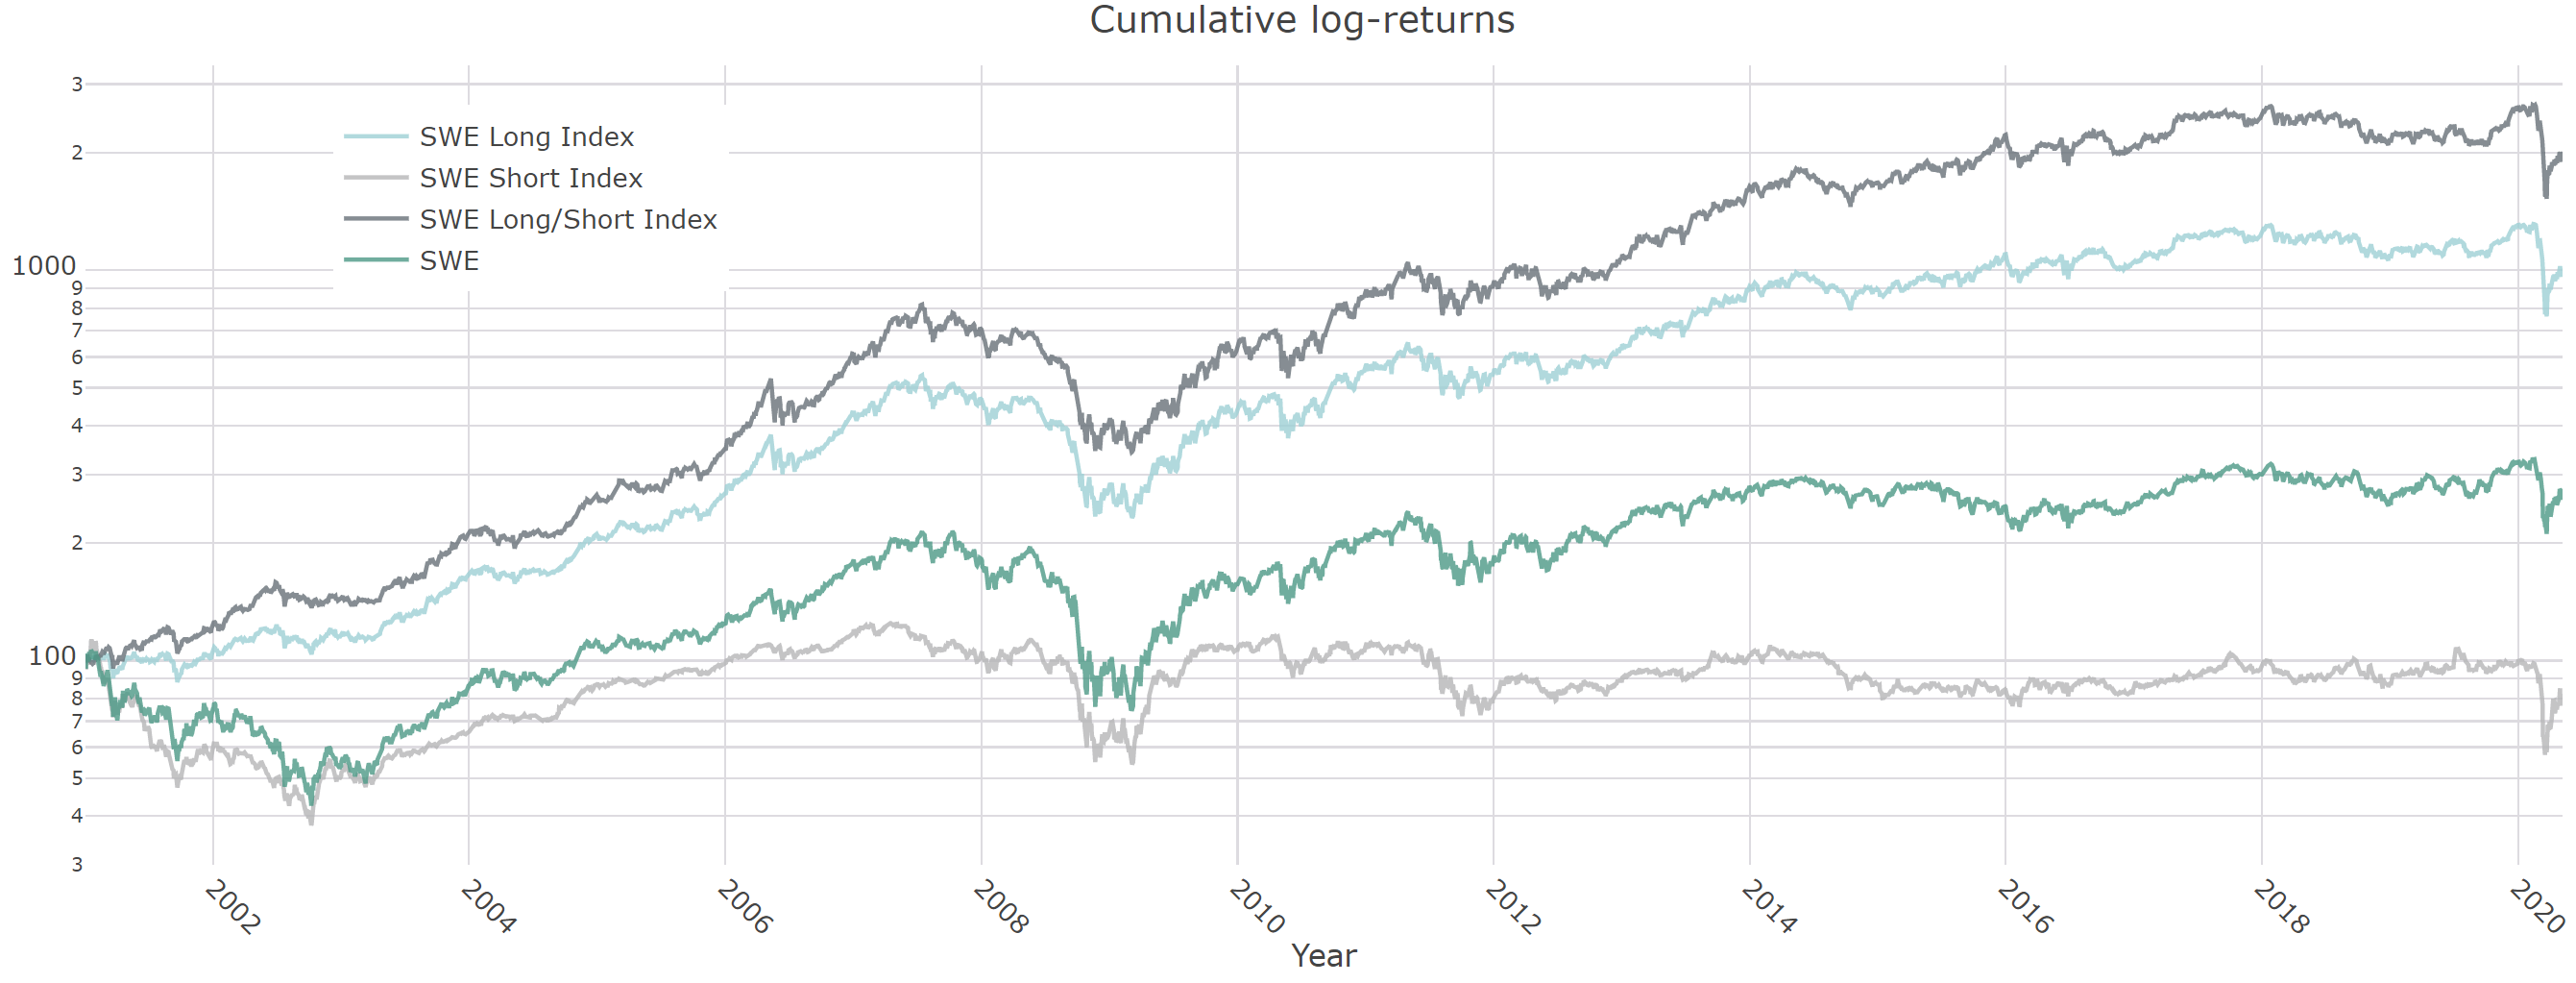
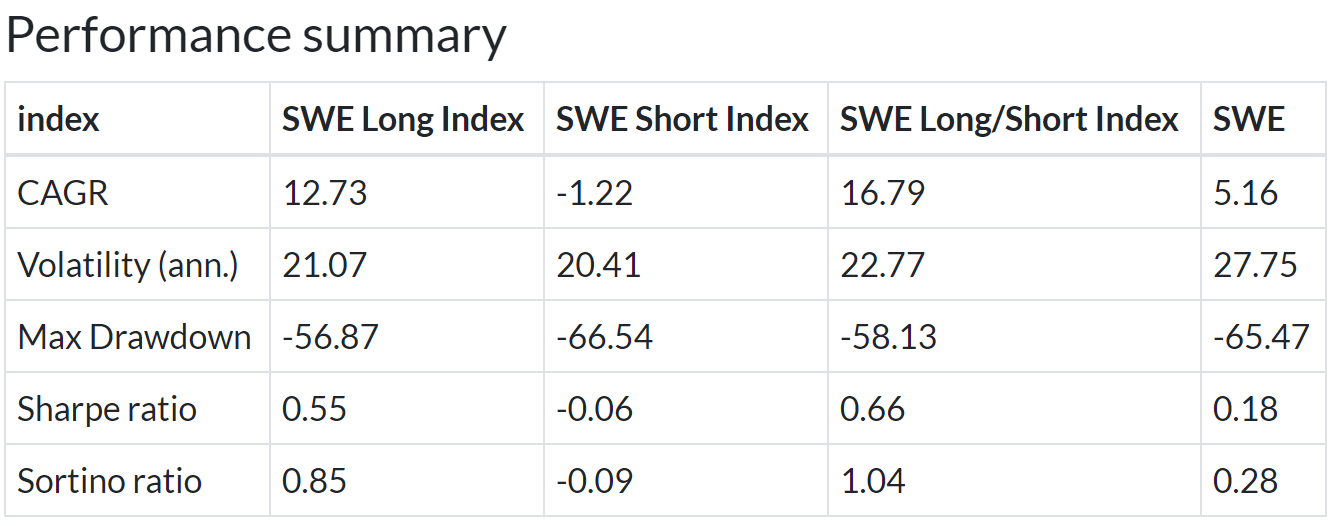
OMX Stockholm All-Share
8% annualized outperformance with lower volatility and smaller drawdown for the long model and almost 12% outperformance for the 130/30 model.
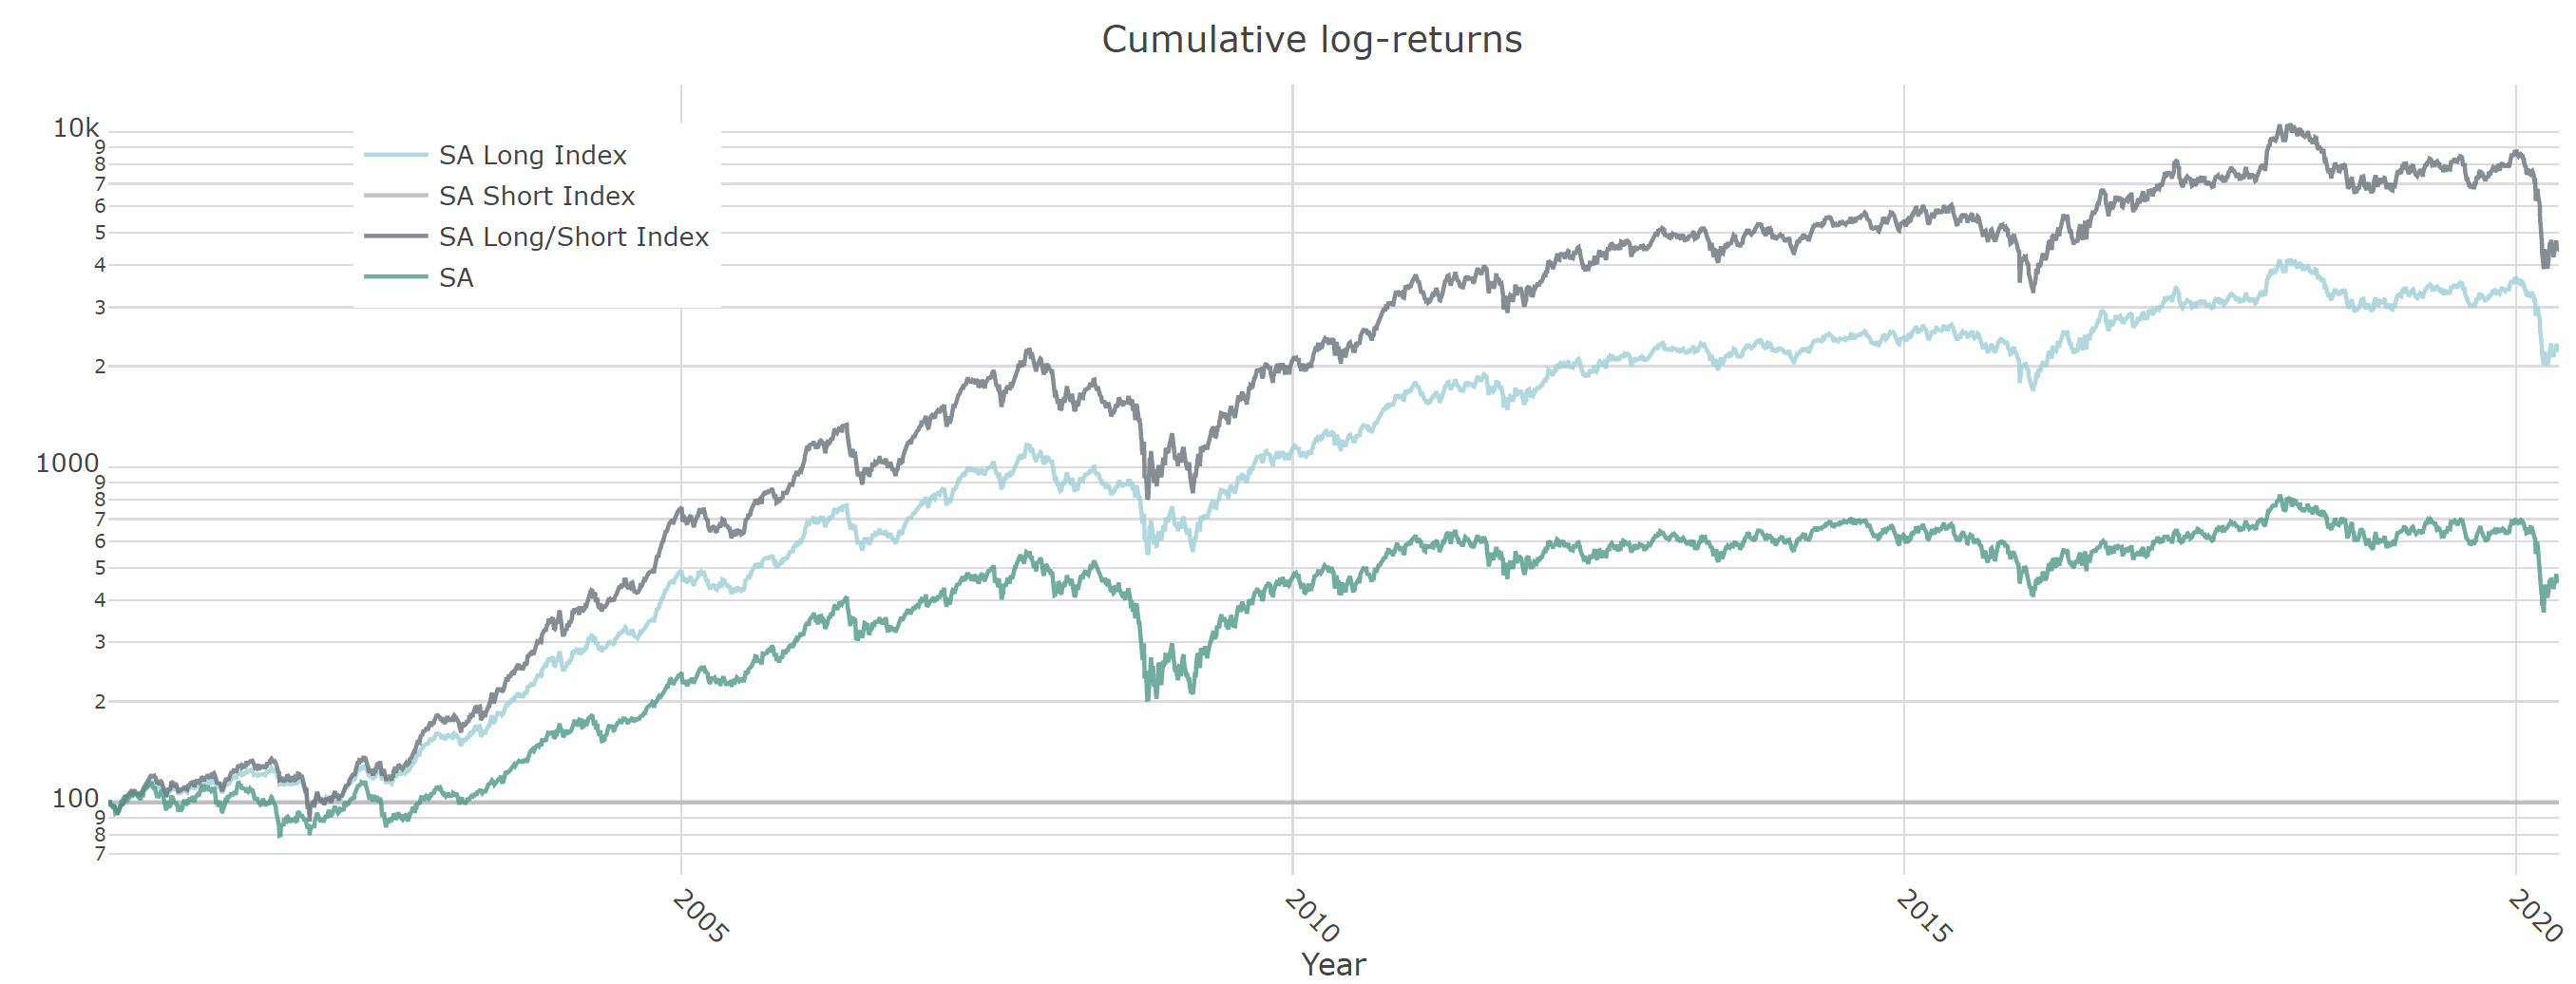
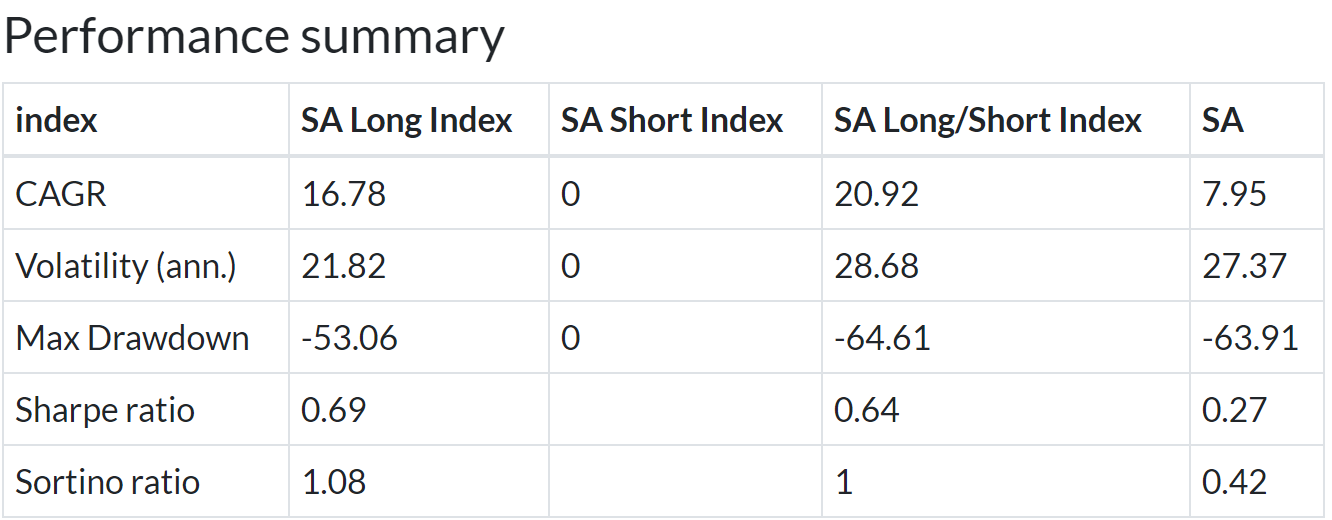
FTSE/JSE Africa All Share
We do not present the short portfolio for South Africa due to the high cost of shorting.
9% annualized outperformance with lower volatility and smaller drawdown.
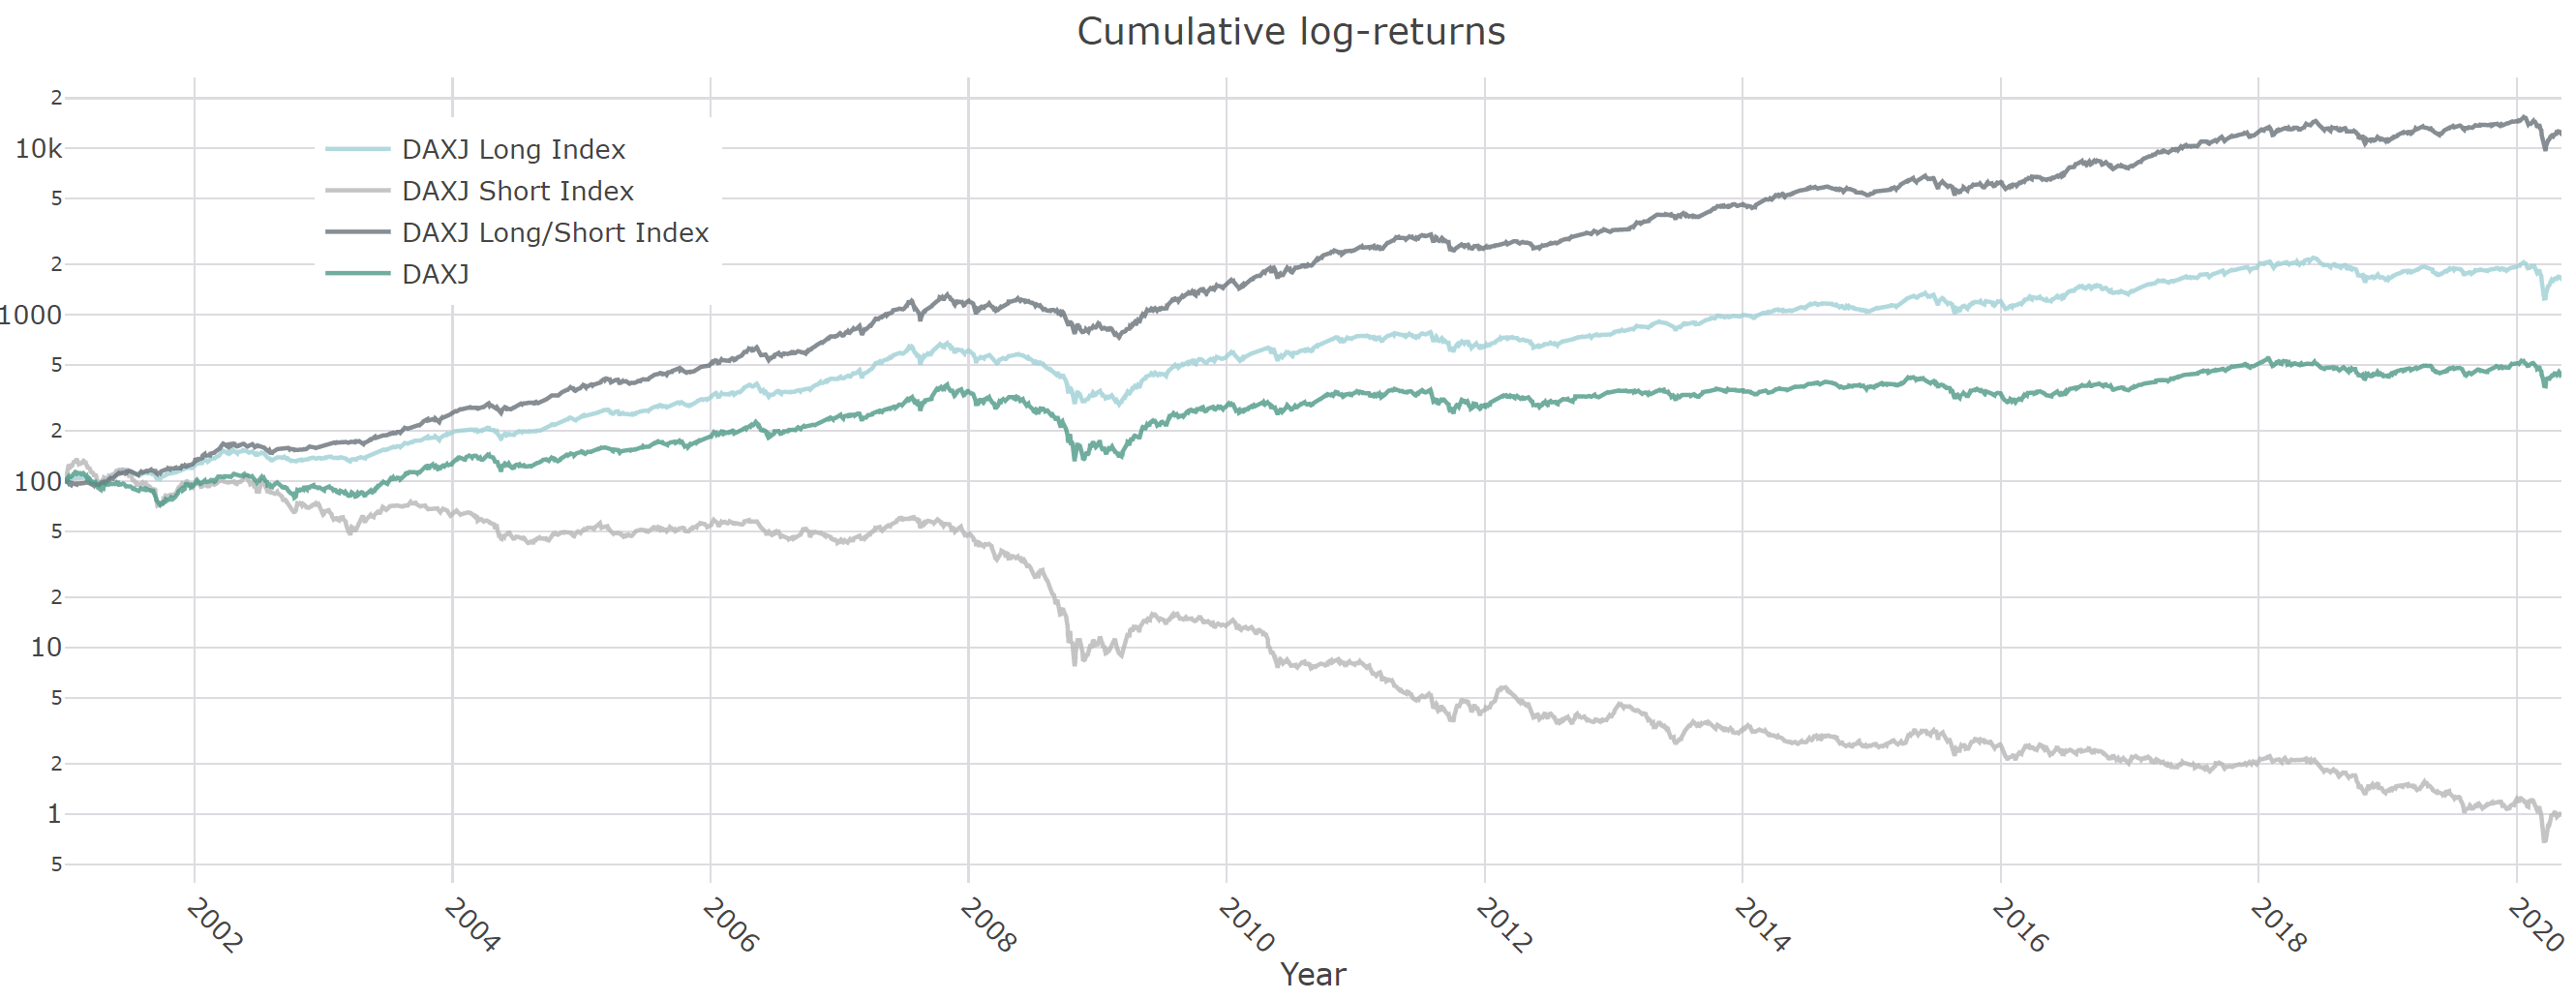
Developped Asia ex Japan
8% annualized outperformance with lower volatility and smaller drawdown for the long model and almost 21% outperformance for the 130/30 model.
S&P Emerging BMI (US Dollar)
12% annualized outperformance with lower volatility and smaller drawdown for the long model and almost 19% outperformance for the 130/30 model.
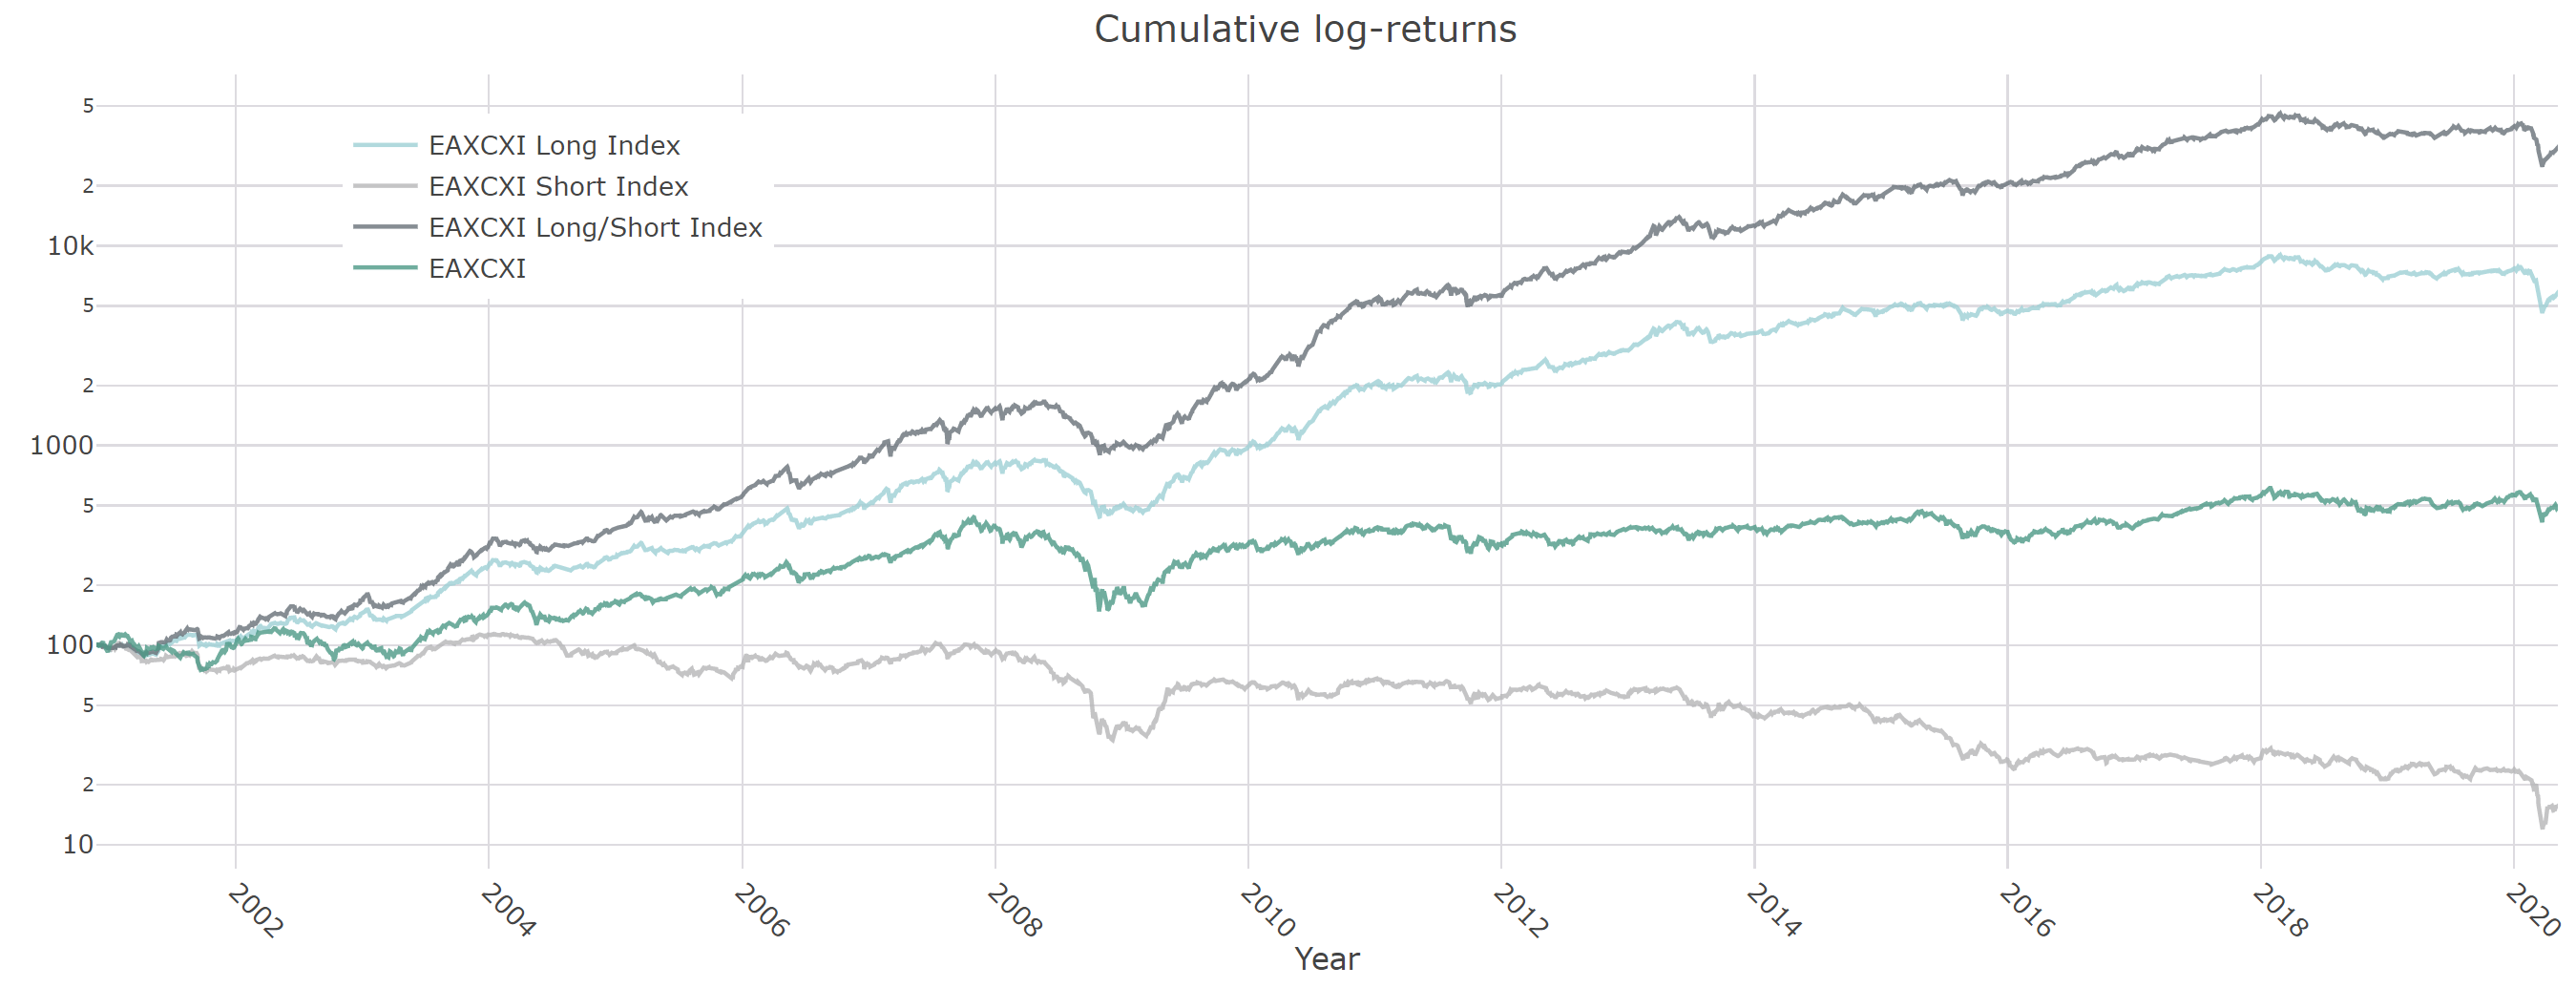
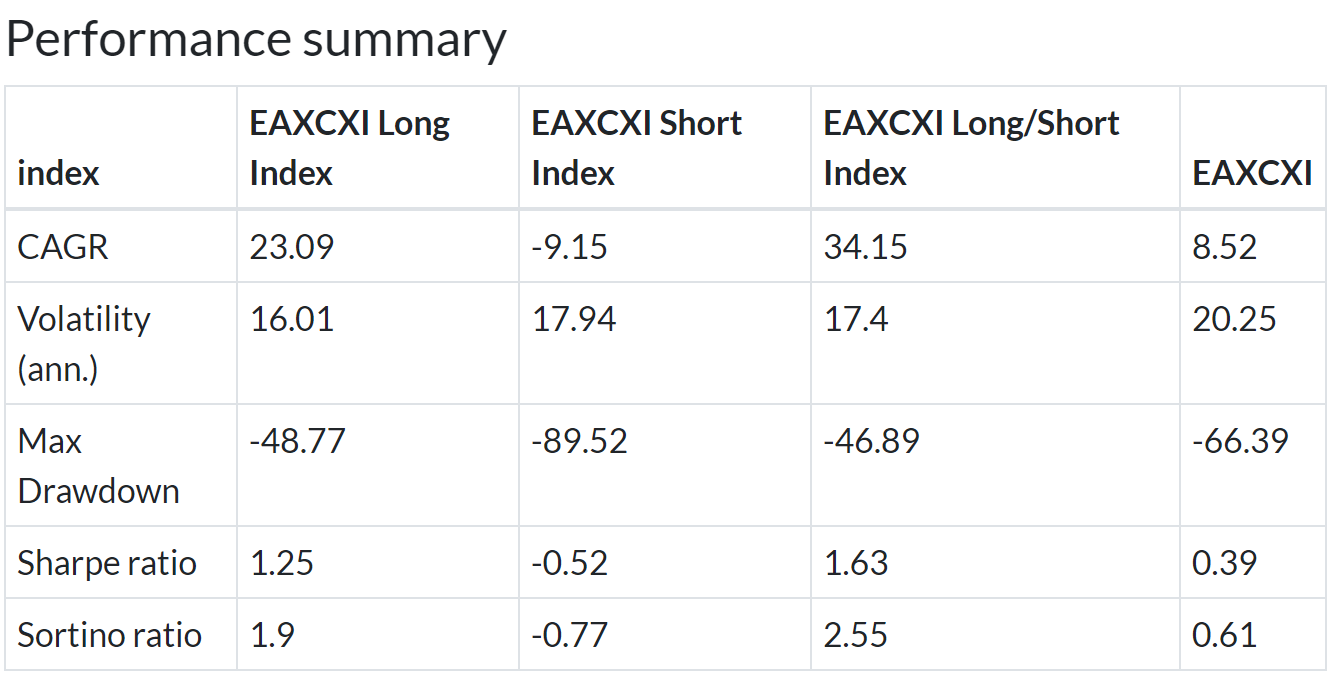
Emerging Asia
15% annualized outperformance with lower volatility and smaller drawdown for the long model and almost 26% outperformance for the 130/30 model.
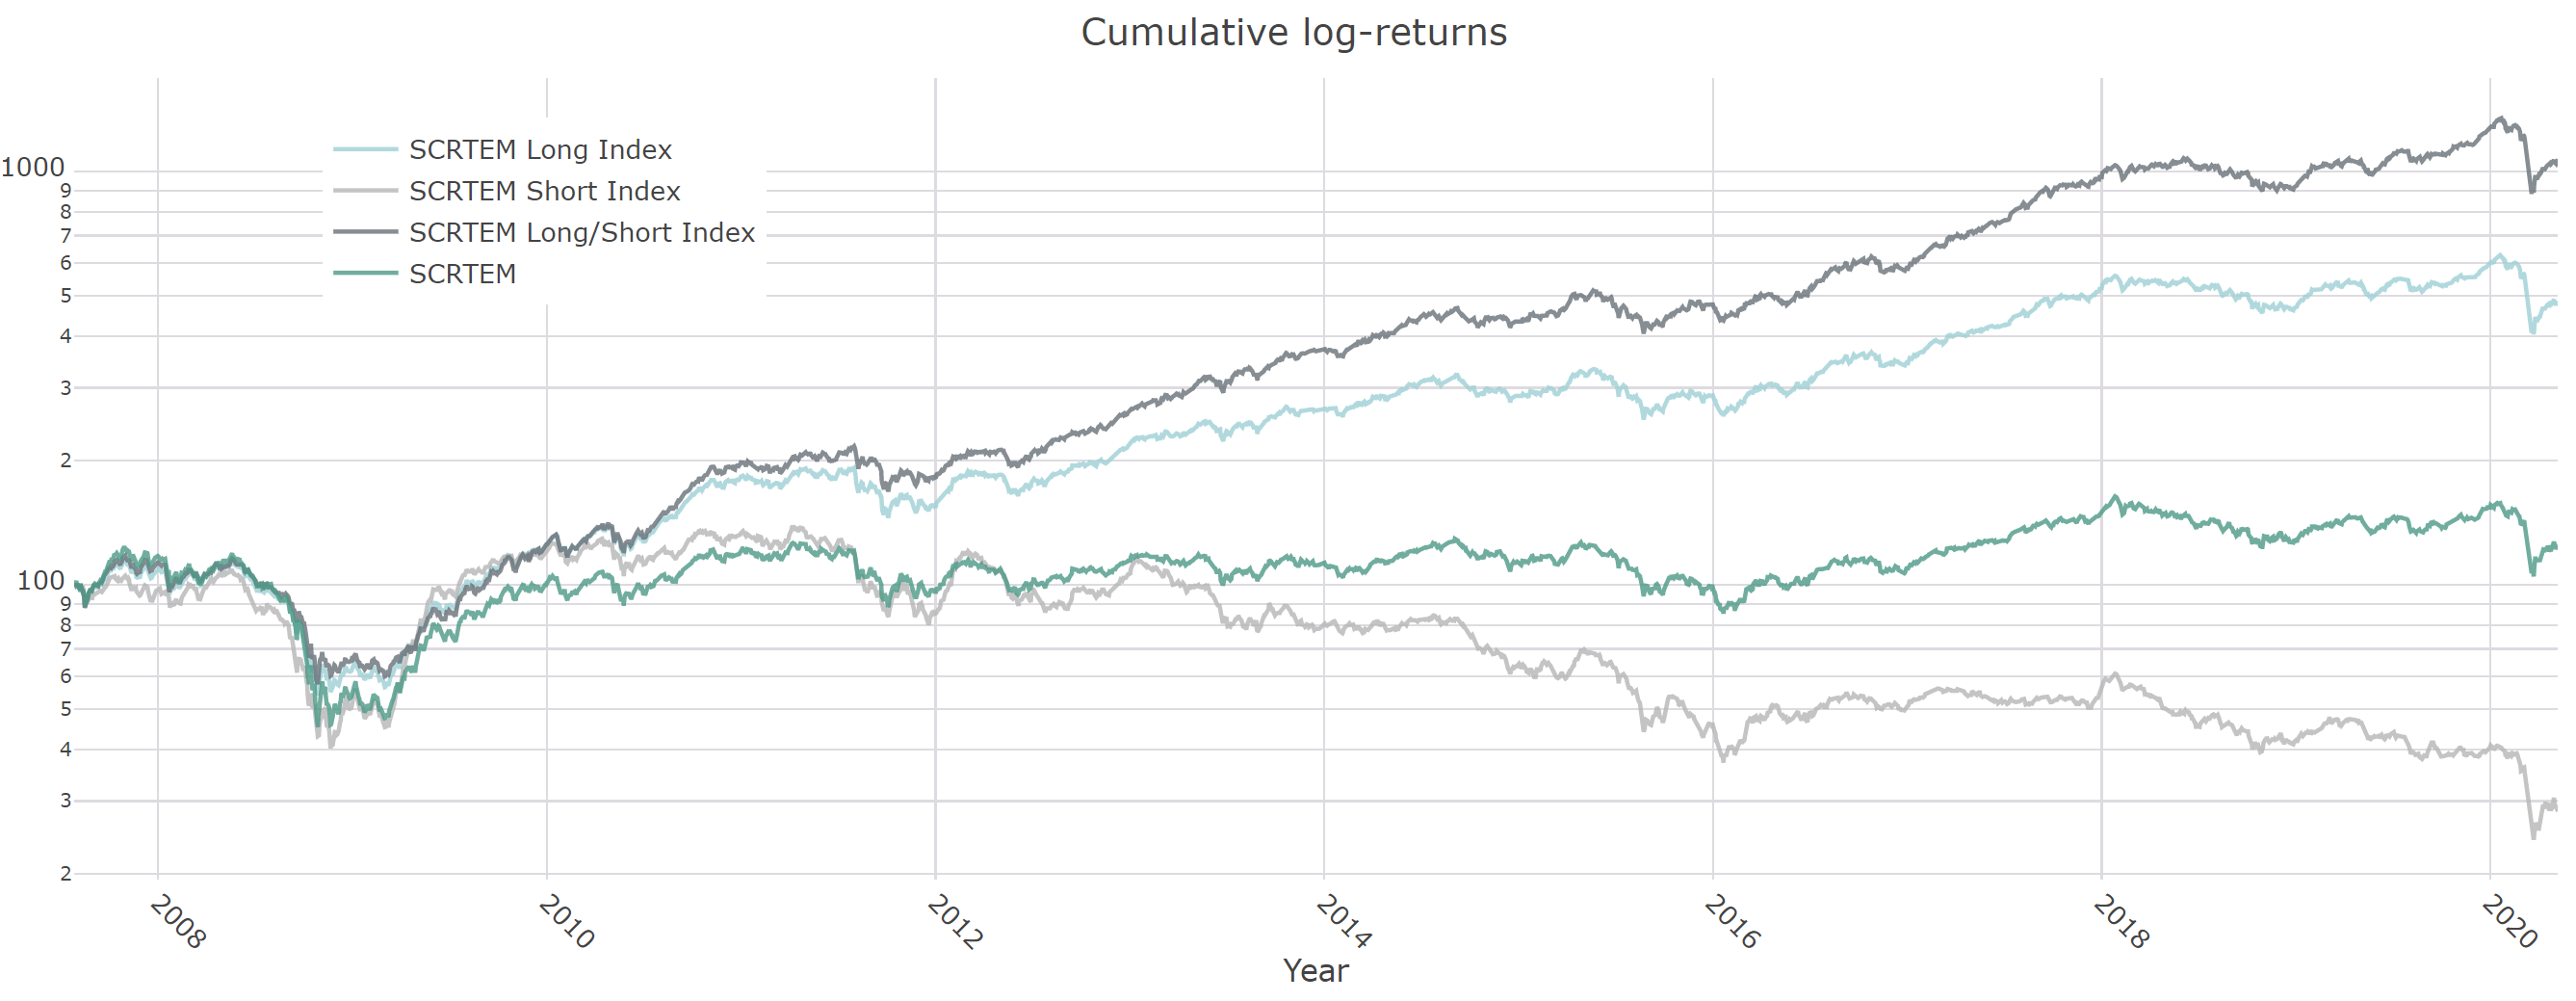
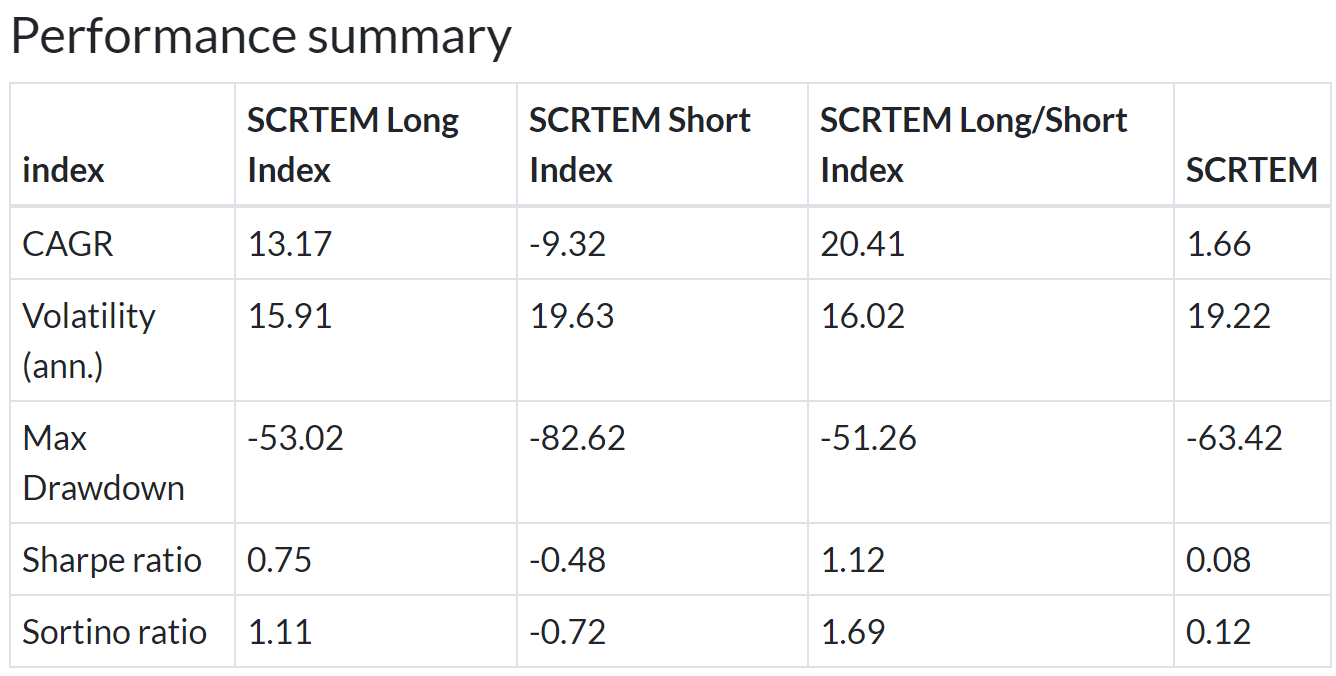
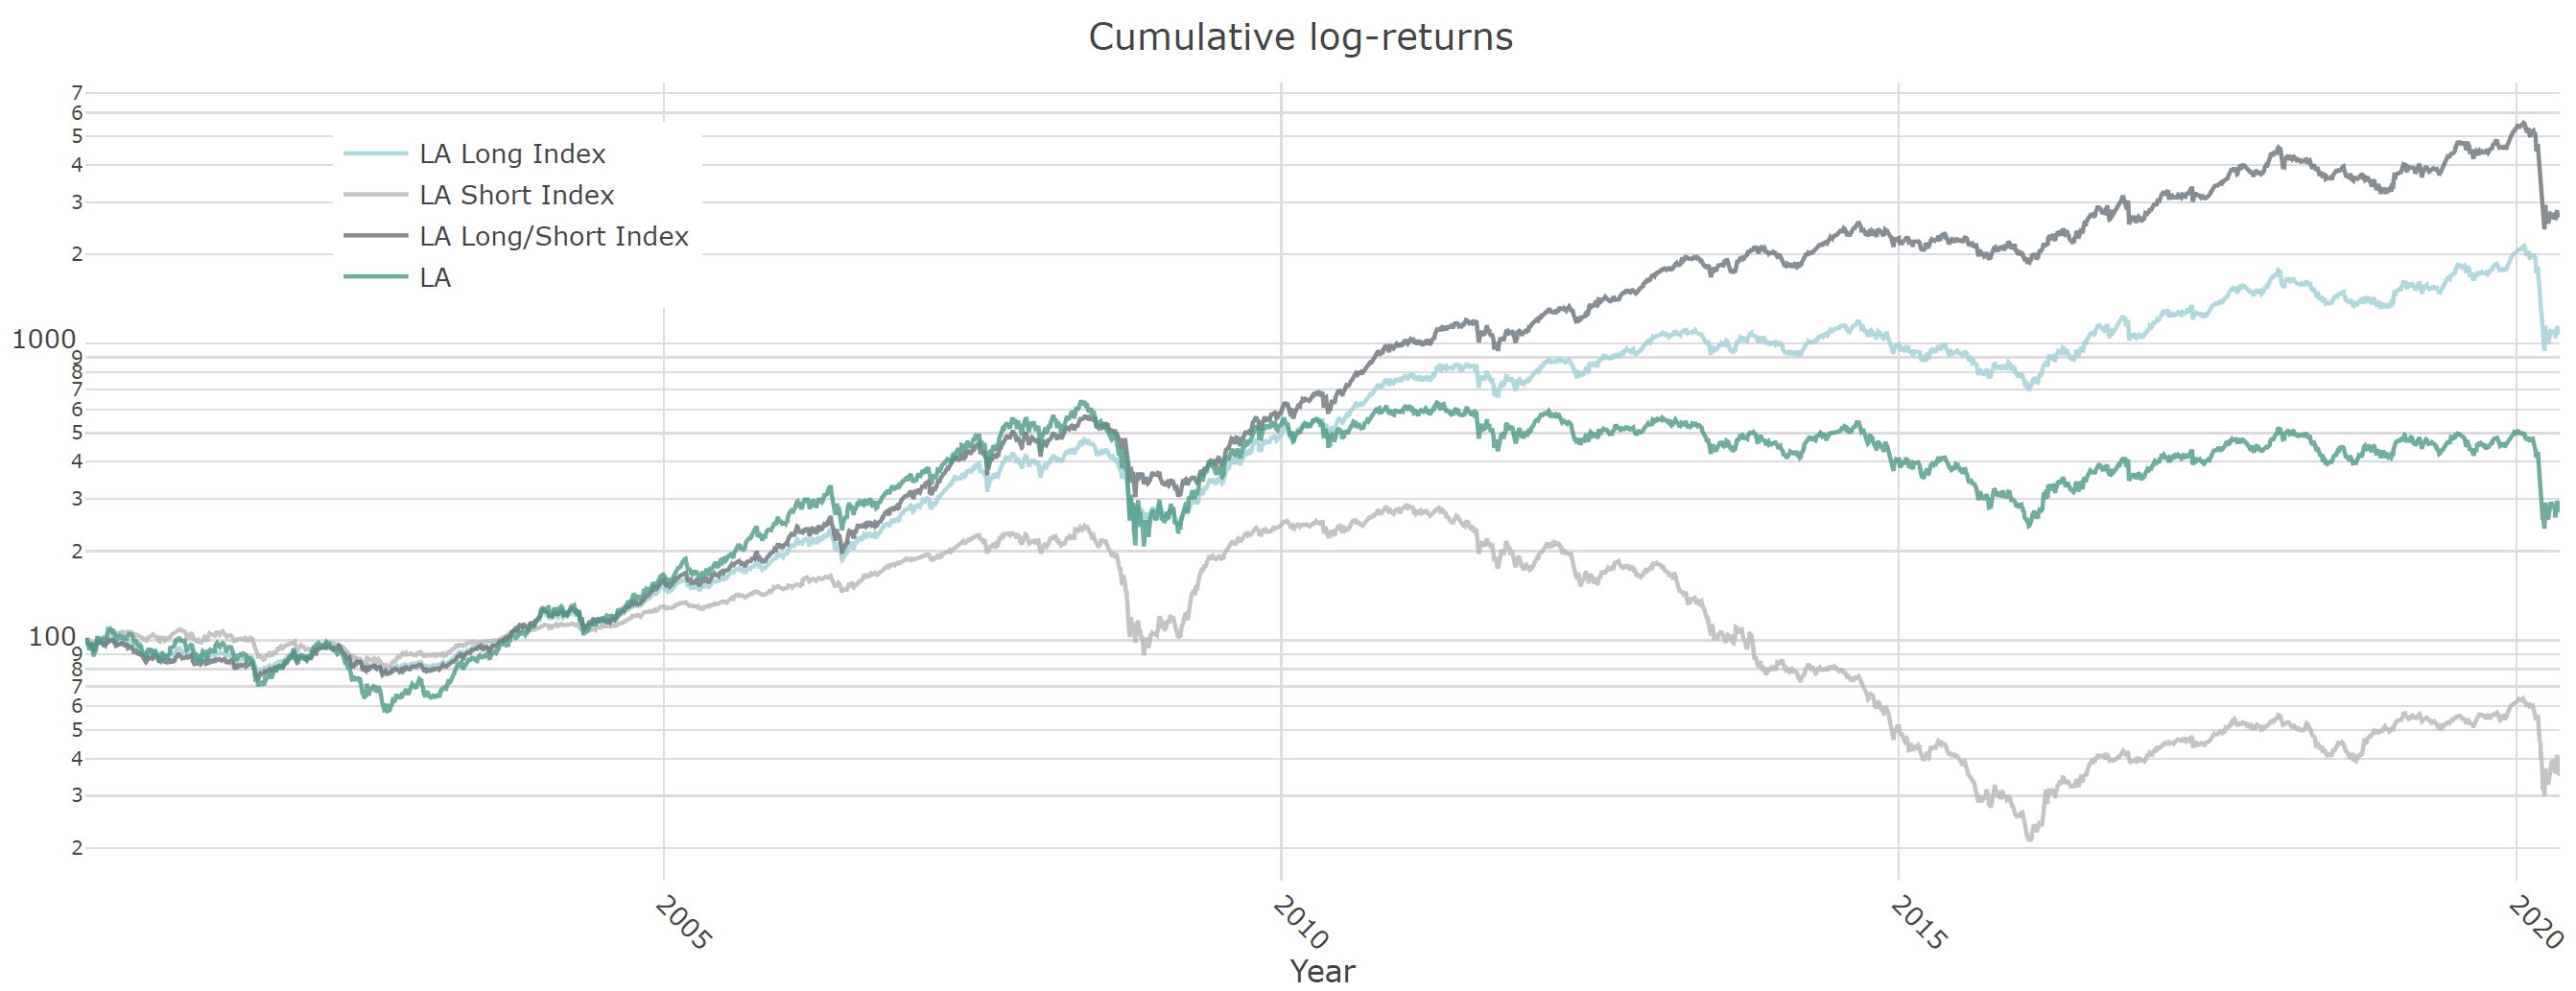
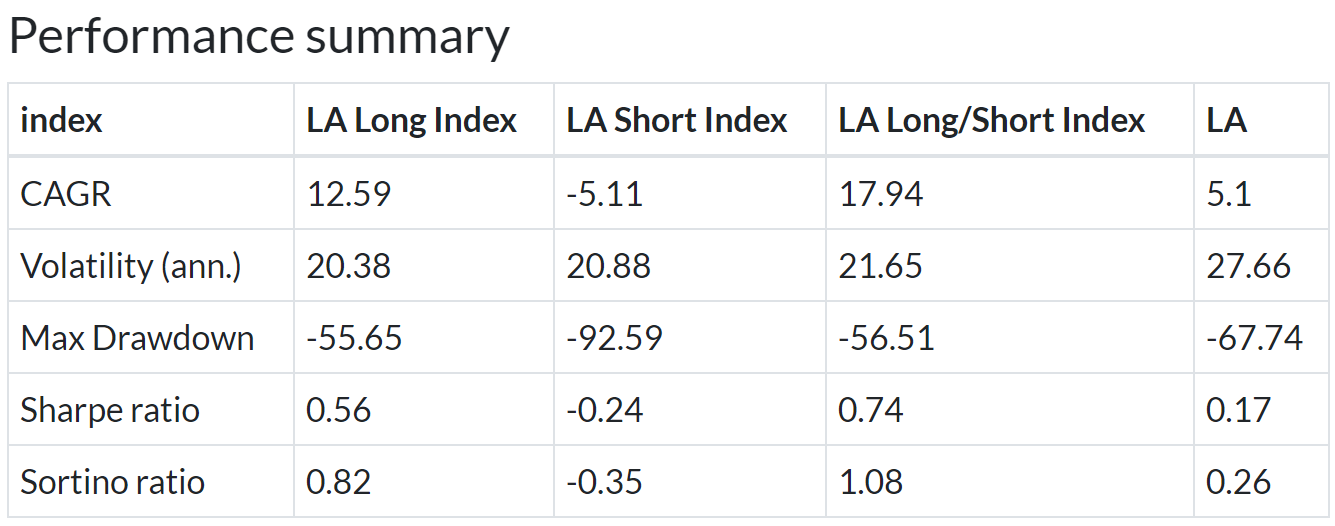
Latin America
8% annualized outperformance with lower volatility and smaller drawdown for the long model and almost 13% outperformance for the 130/30 model.
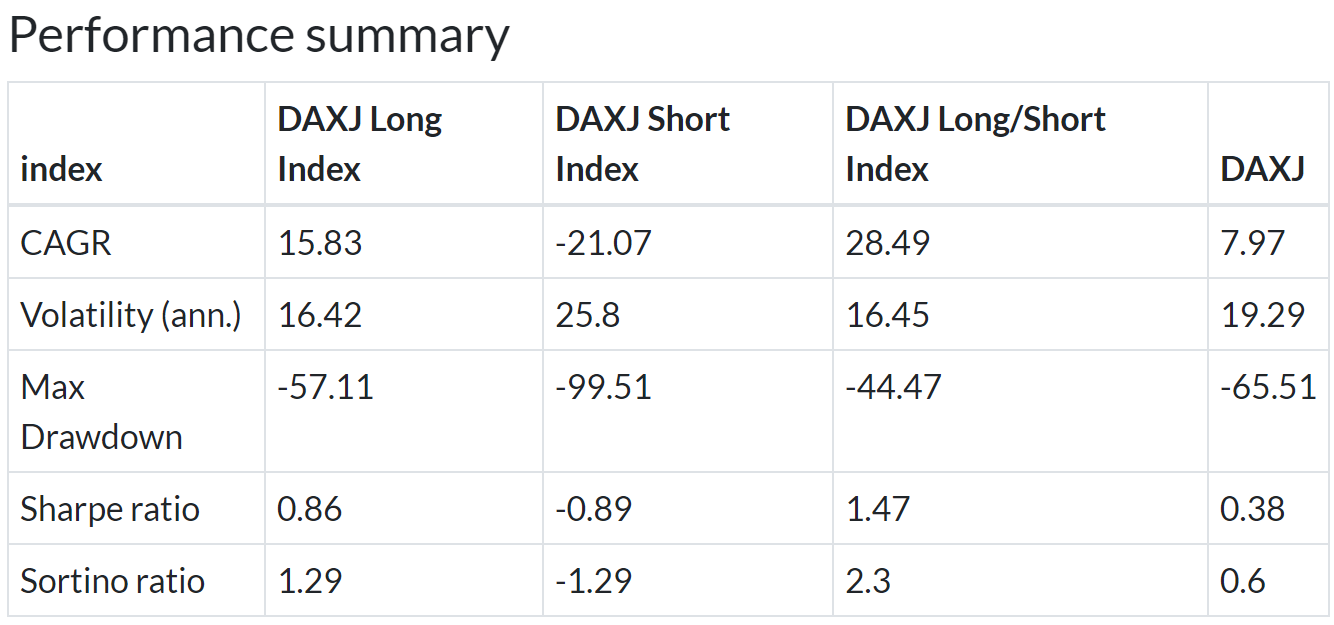
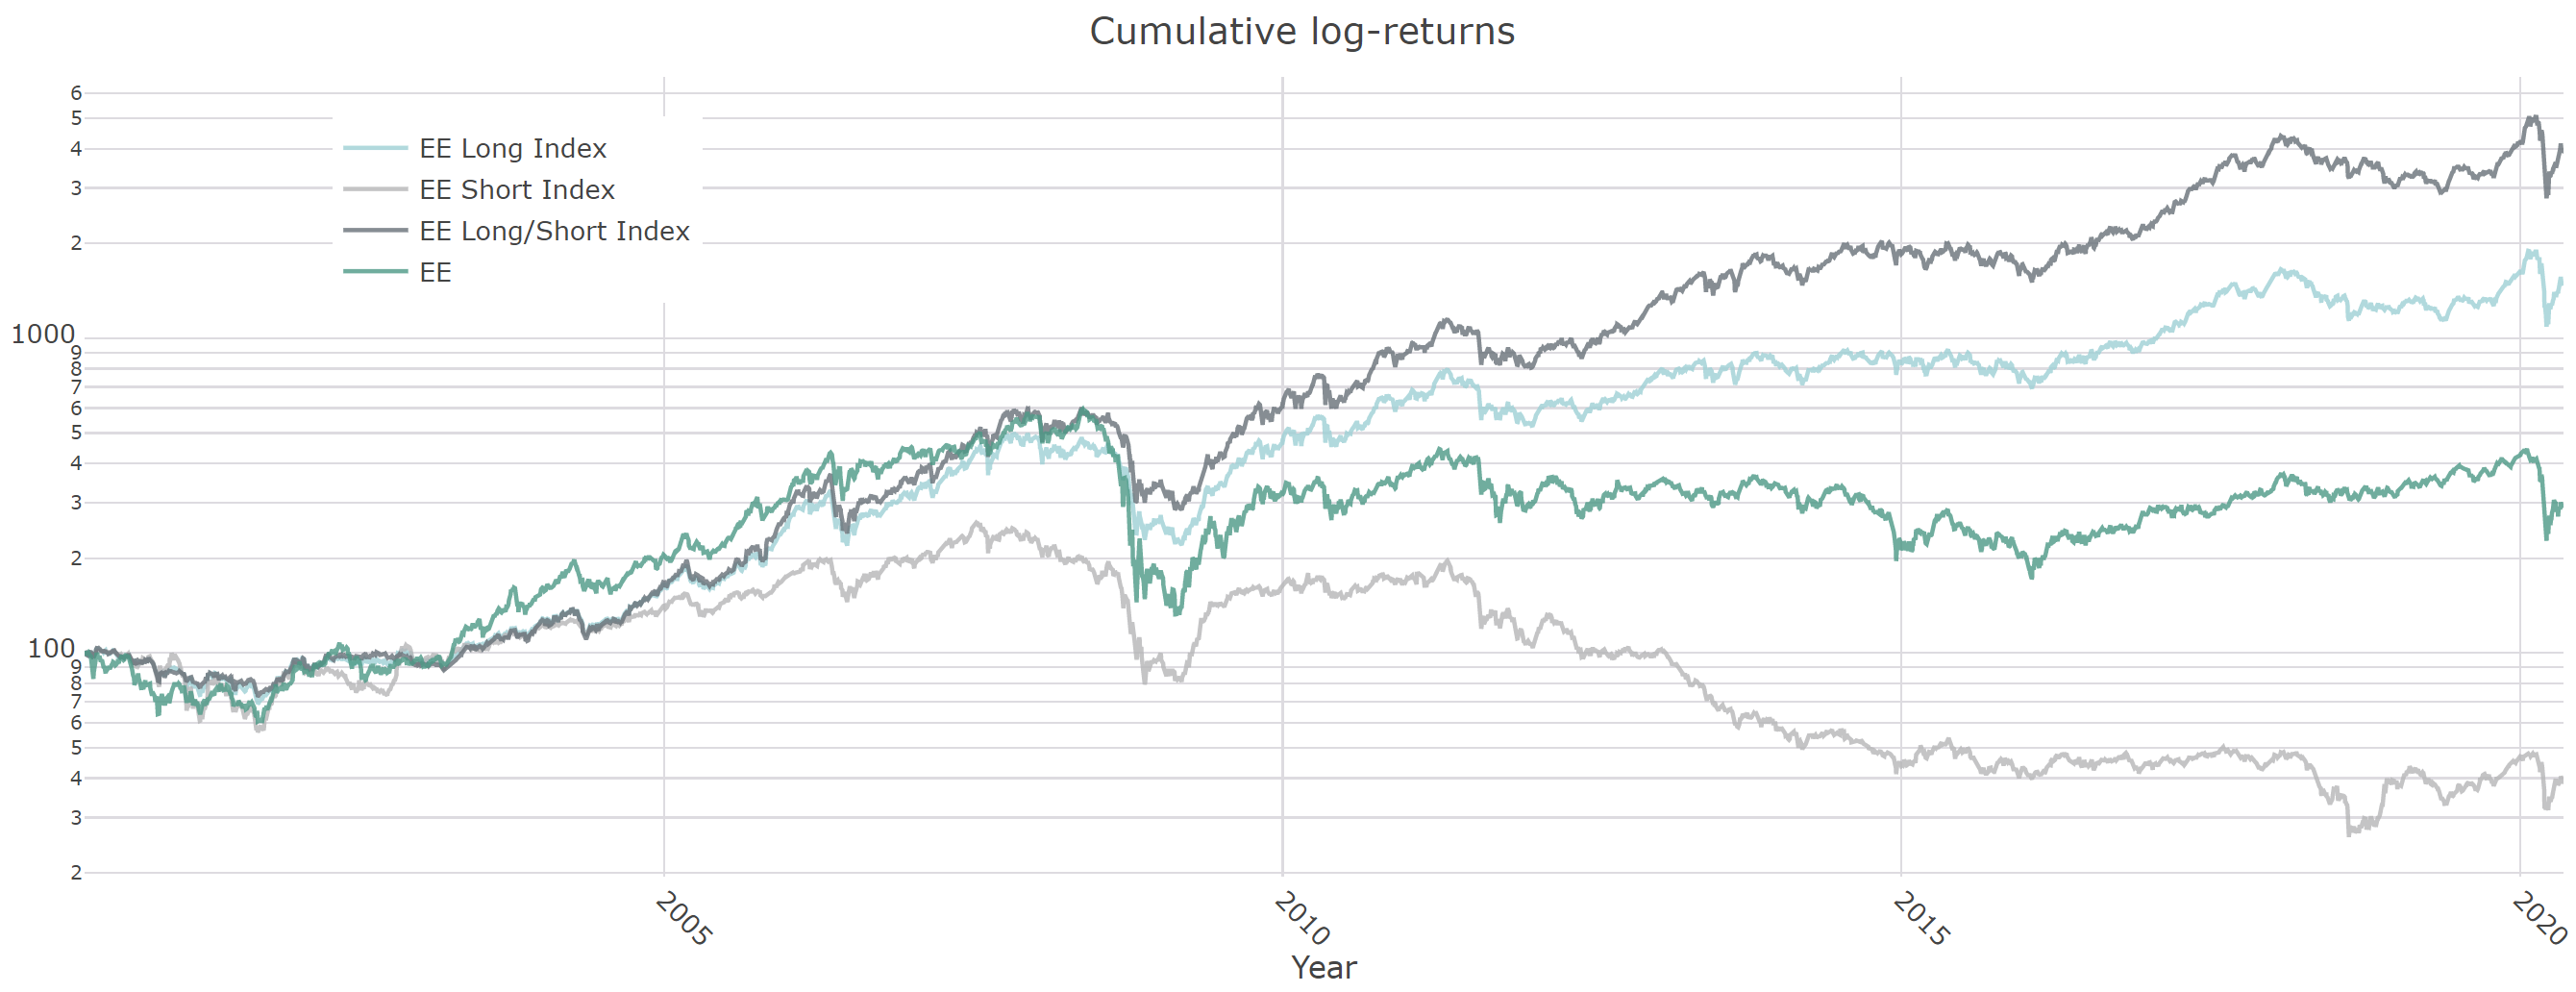
Eastern Europe
9% annualized outperformance with lower volatility and smaller drawdown for the long model and almost 15% outperformance for the 130/30 model.
Middle East
12% annualized outperformance with lower volatility and smaller drawdown for the long model and almost 17% outperformance for the 130/30 model.
In this article we have presented the results of our model on non-exhaustive list of indices. They work similarly when run on country/regional supersectors (defensive, cyclical and sensitive) and can be run on any diversified index with at least 150 liquid stocks.
They make an ideal replacement for traditional cap or price weighted indices and outperform handily equal-weighted indices too. In coming articles we will show how they can be integrated into asset rotation models and how a touch of timing in deciding when and to which degree (more than the 30% from the above examples) to have the short leg on can substantially improve performance.
Thanks for reading and as always, we welcome commentaries.