US Sentinel - an introduction
Investment Philosophy: Combining Good Ideas Differently
Investing has a lot in common with biology. Life has endured for billions of years under changing and sometimes very hostile conditions.
This was possible due to the uncanny capacity of biological forms to select and combine the characteristics that best guaranteed its survival. Another essential element, both at the micro and macro level, has been diversity. It made the risk of extinction when faced with adverse or unforeseen elements, much lower.
We invest by selecting and combining some original and many old ideas emanating from brilliant minds from various fields. Our expertise resides in the mixing and dicing of those ideas, a deep knowledge of their underlying rationale and the understanding of the dynamics of their respective interactions.
We are obsessed with diversification. We diversify models to be as agnostic as possible to their parameters, we diversify the universe of investment whenever possible, we diversify the timing of our investment and we diversify how we place orders.
The luck factor is for casino aficionados, not for investment professionals.
Strategy Backbone: Follow but not Blindly
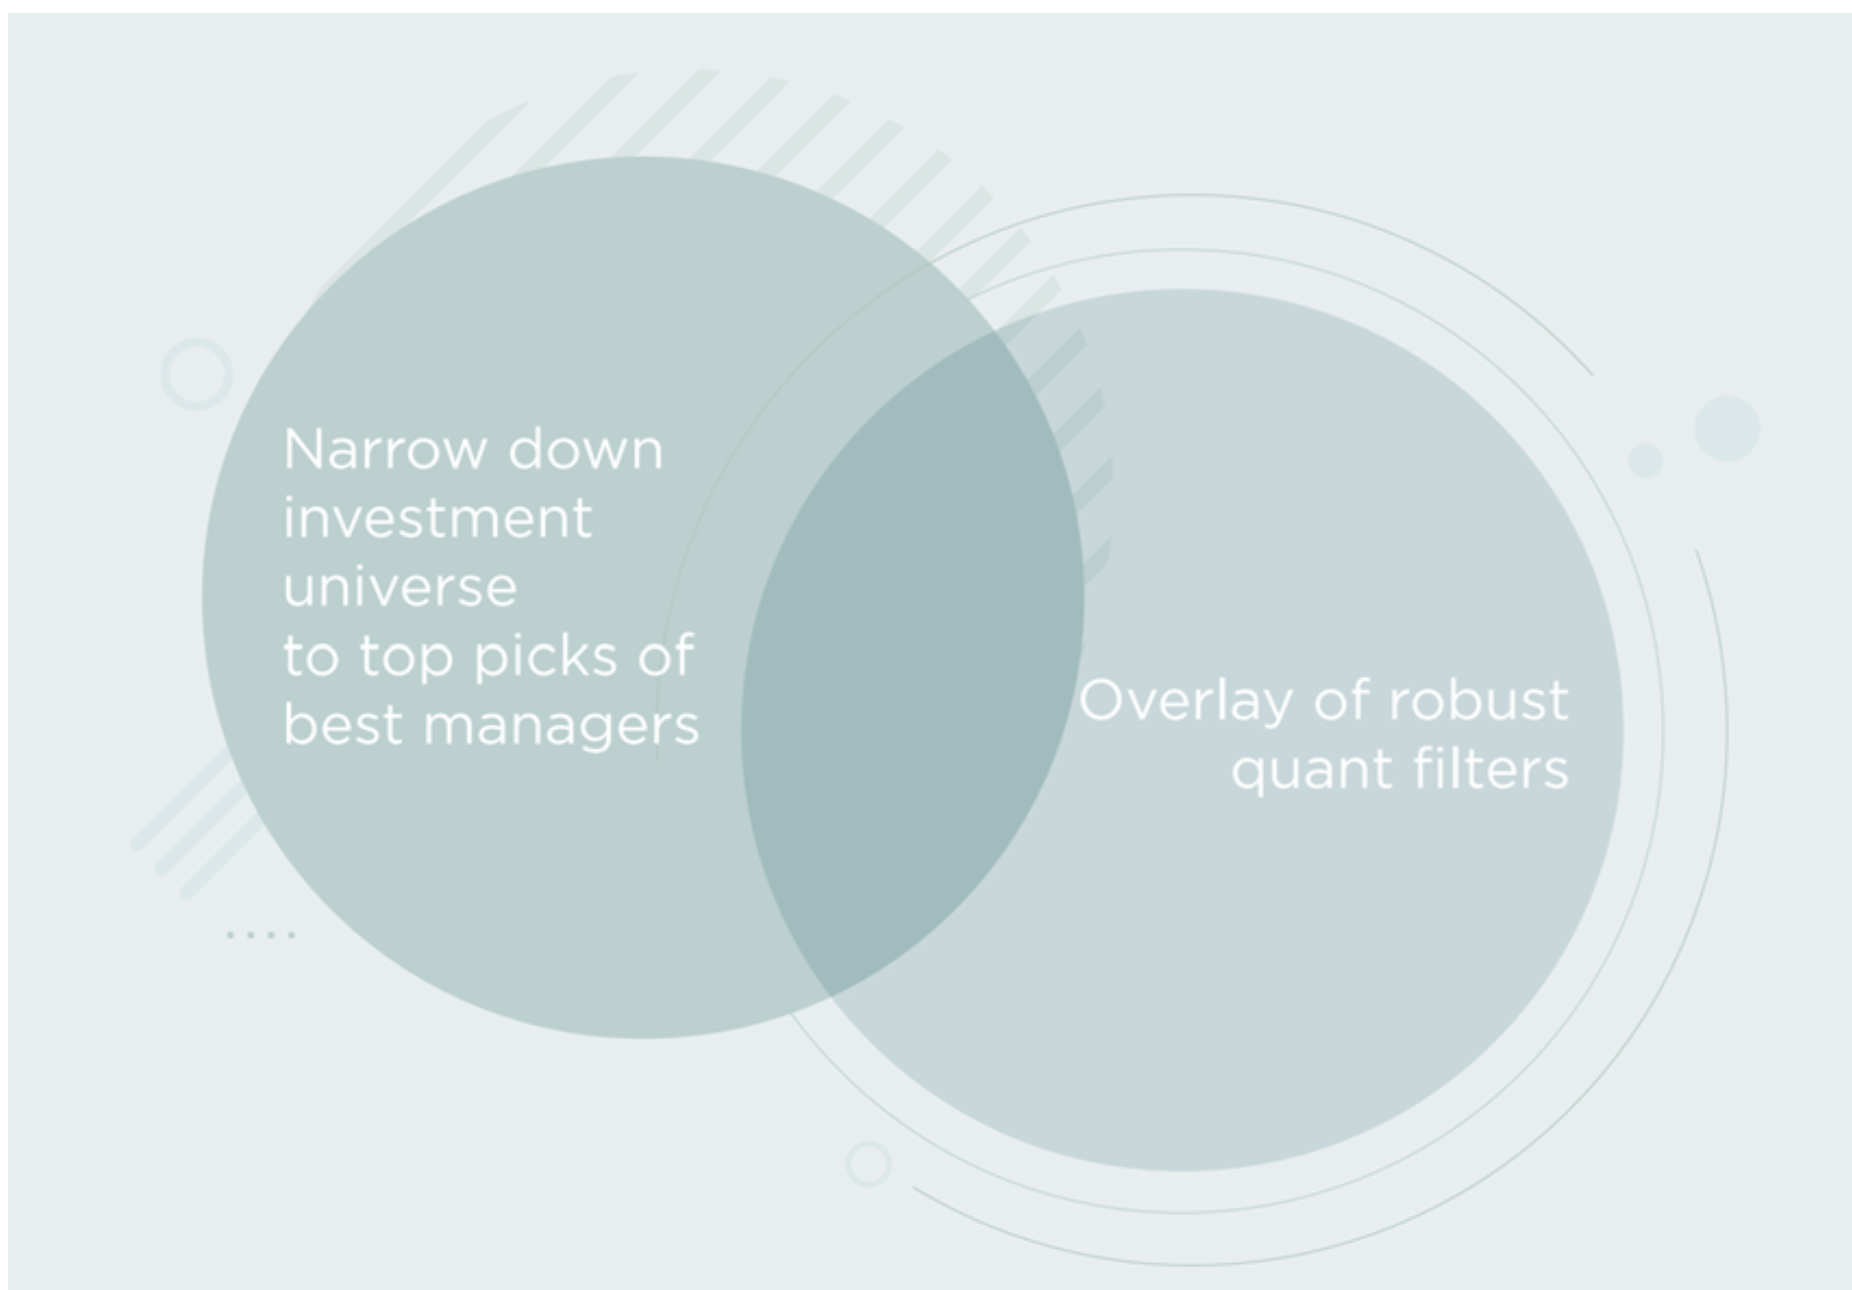
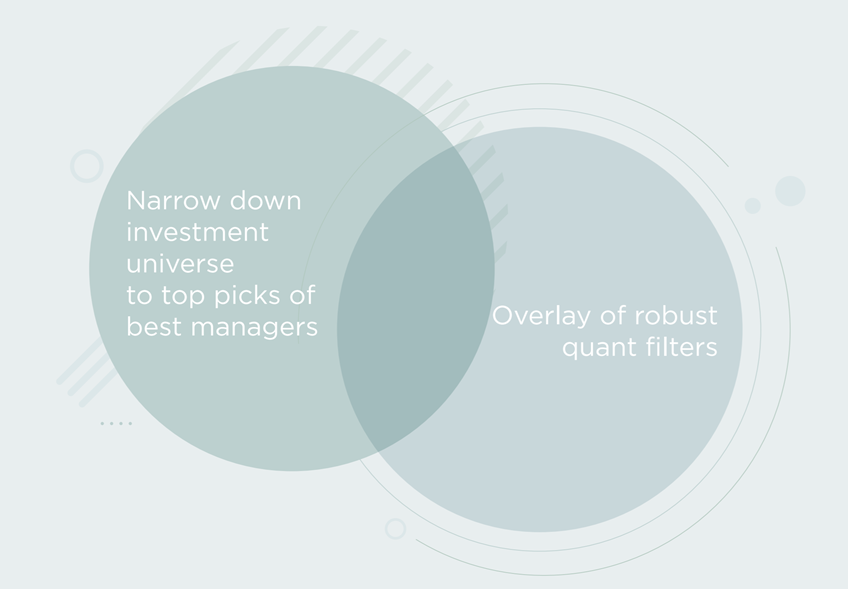
The strategy consists of investing into a portfolio of stocks traded in the United States using multi-layered quantitative filters.
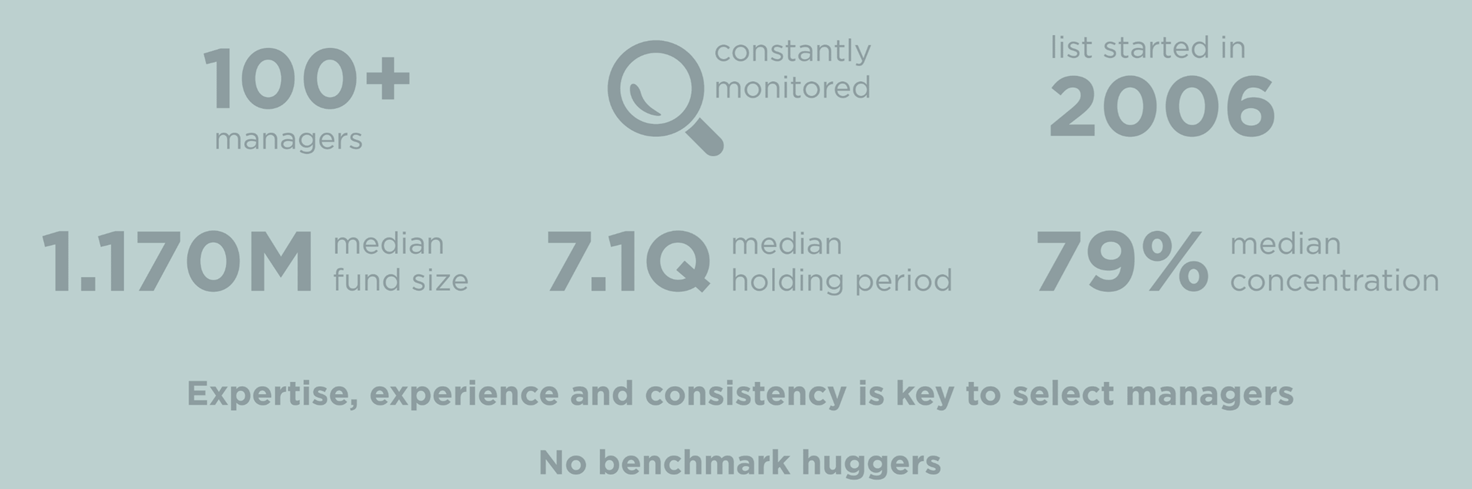
The stock selection universe is drawn from the holdings of approximately 140 funds managers chosen using a consistent framework since 2006 (US Sentinel is traded live since November 2006). Managers conviction, concentration, the degree of consensus are some elements used in the creation of the initial 1000-1200 stocks universe.

| index | Top 5 | Top 10 | Top 20 | High Conv. | S&P500 TR |
|---|---|---|---|---|---|
| CAGR | 15.06% | 15.32% | 13.02% | 17.11% | 7.87% |
| Volatility (ann.) | 19.43% | 19.56% | 19.17% | 19.08% | 18.21% |
| Max Drawdown | -55.86% | -56.93% | -58.74% | -49.15% | -55.25% |
| Calmar ratio | 0.27 | 0.27 | 0.22 | 0.35 | 0.14 |
| Sharpe ratio | 0.80 | 0.80 | 0.71 | 0.90 | 0.49 |
| Sortino ratio | 1.25 | 1.26 | 1.12 | 1.44 | 0.77 |
We later apply more than 50 different independent quantitative models to filter out this universe to an approximately 300- stock portfolio with strict liquidity constraints. The portfolio is rebalanced on a quarterly basis.
While the independent quantitative models are not equal weighted to get the final portfolio, doing so would result in almost the same historical results.
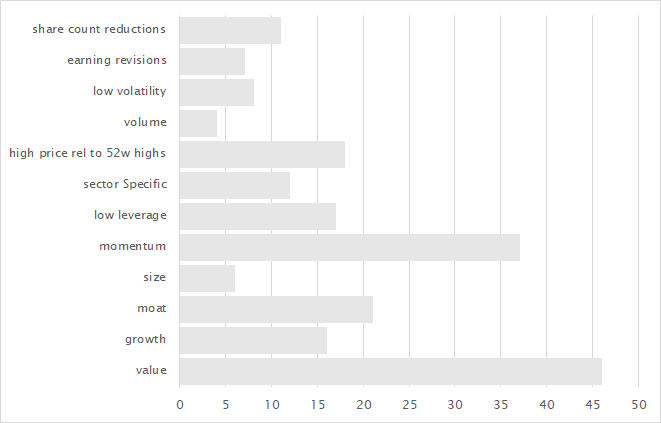
Each quantitative models use a combination of factors. The frequency of appearances of the various factors families. The families are expressed with various different flavours. For example value can be the enterprise value to free cash flow in a model but it can be Price to Warren Buffet's owners earnings in another.
The final portfolio is less volatile, had lower drawdown and an higher return than any of the alternatives presented above.


| index | S&P500 TR | US Sentinel |
|---|---|---|
| CAGR | 6.16 | 18.58 |
| Volatility (ann.) | 18.55 | 18.26 |
| Max Drawdown | -55.25 | -44.50 |
| Calmar ratio | 0.11 | 0.42 |
| Sharpe ratio | 0.40 | 0.99 |
| Sortino ratio | 0.64 | 1.58 |
The next plot shows the relative outperformance of US Sentinel versus the S&P500 TR on a rolling basis. The right axis indicates the year you invested in US Sentinel and the top axis shows the year you exited the strategy. As one can see, US Sentinel outperforms significantly the S&P500 TR in almost all time periods. The only investor who wouldn't have outperformed the S&P500 TR is the one having invested at the beginning of 2016 and exited at the end of 2016!
What is remarkable is that Sentinel has continued to outperform in the past few years despite the fact that the markets have been pushed higher by a small number of mega caps and some niche industries.

Looking at the distribution of monthly return one can see why the outperformance has been steady.

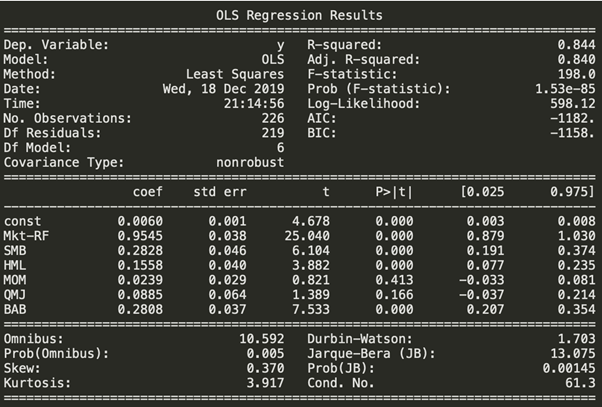
The factor exposure analysis using 6 factors (fama french + mom + quality minus junk + betting against beta) show that no single factor has been driving this outperformance.
It also demonstrate that the outperformance has not only been the consequence of the factor exposure as there is a residual 7.2% alpha (annualized monthly 0.6% OLS const) which can not be explained by those 6 factors.
In this short article we have described how one can, by carefully selecting money managers to create a stock universe and filter this universe with a high number of lowly correlated quantitative screens, achieve steady outperformance accross various market cycles and regimes.
In a future article we will show how the same exact quantitative screens generate steady outperformance on any major popular broad stock indices. We will also show that using the S&P 500 as a benchmark is not ideal and even if our customed benchmark has a higher performance than the S&P 500 its higher correlation to the strategy makes it a better fit for comparison and tactical risk mitigation.
For those wary of current markets valuation and the length of the current bull market, we will also present how we deal with the market environment in a forthcoming article.
You can reach us at research (at) nava.capital
List of tickers (Bloomberg) the strategy is invested in since mid-november 2019 (% allocation to each stocks available upon request):
||||||||||
---|---|---|---|---|---|---|---|---|---|---
AAPL US|AXP US|CMPR US|FISV US|INTC US|MDT US|PAAS US|STX US|VST US
ABG US|AZO US|CNC US|FLT US|INTL US|MELI US|PAGS US|STXS US|W US
ABMD US|BABA US|COUP US|FNKO US|INVA US|MIC US|PANW US|SUM US|WCC US
ACAD US|BAM US|CRC US|FTDR US|IOVA US|MIK US|PCG US|SYF US|WHR US
ACGL US|BBBY US|CRM US|FWONK US|IRMD US|MLCO US|PDD US|SYY US|WM US
ACHN US|BIIB US|CSTE US|GE US|ITT US|MOMO US|PEP US|TAL US|WRLD US
ACIU US|BK US|CTB US|GLPG US|JD US|MRK US|PETQ US|TAST US|WSBF US
ADBE US|BKNG US|CTXS US|GLPI US|JHG US|MRTX US|PHM US|TBI US|WSM US
ADPT US|BLDR US|CURO US|GOGO US|JNJ US|MSFT US|PRPL US|TDG US|WUBA US
ADS US|BMRN US|CUTR US|GOLD US|JOBS US|MTH US|PWR US|TEAM US|WW US
ADSK US|BMY US|CVI US|GOOG US|JPM US|MTSI US|PYPL US|TECH US|WYND US
AEM US|BPMC US|CVNA US|GOOGL US|KAR US|MU US|QCOM US|TECK US|XOMA US
AES US|BPOP US|CZR US|GPN US|KMX US|MX US|QSR US|TLRD US|XPO US
AGN US|BRK/B US|DFS US|GPRO US|LAD US|NAV US|RARX US|TOL US|XRX US
AGYS US|BX US|DHI US|GRBK US|LBRDK US|NDLS US|RGLD US|TPX US|YMAB US
ALLK US|C US|DHR US|GS US|LBTYK US|NEM US|RNG US|TRI US|YNDX US
ALLY US|CARG US|DIS US|GSKY US|LDOS US|NFLX US|SAGE US|TRP US|YY US
ALNY US|CASH US|DOVA US|GTN US|LEN US|NICE US|SBAC US|TSM US|ZBH US
ALXN US|CBPO US|DRNA US|GTX US|LEN/B US|NIU US|SBGL US|TTWO US|ZGNX US
AMAT US|CBRE US|EAF US|HBI US|LIN US|NOA US|SE US|TWLO US|ZTO US
AMGN US|CBS US|EBAY US|HCA US|LKQ US|NOAH US|SEDG US|TWTR US|ZTS US
AMRN US|CCC US|ECPG US|HCSG US|LLNW US|NONOF US|SGMS US|TYL US|
AMT US|CCK US|EIDX US|HD US|LNG US|NOW US|SGRY US|UAL US|
AMZN US|CDTX US|EL US|HE US|LPG US|NRG US|SHW US|UBER US|
AN US|CE US|ENB US|HLF US|LPLA US|NTES US|SIC US|UFI US|
ANTM US|CELG US|EQIX US|HMHC US|LPX US|NTRA US|SIMO US|UNH US|
APPN US|CFG US|ESI US|HNGR US|LRCX US|NTUS US|SKX US|USFD US|
ARNA US|CHDN US|ET US|HPQ US|LVS US|NVR US|SMAR US|UTHR US|
ASND US|CHE US|ETSY US|HUM US|LX US|NWL US|SNAP US|V US|
ATH US|CHTR US|EW US|IBKR US|MA US|NYT US|SPGI US|VC US|
ATHM US|CIGI US|EXPE US|IHRT US|MASI US|OMF US|SPH US|VICI US|
ATVI US|CLS US|FAST US|IMMU US|MCK US|ONCE US|SPOT US|VIPS US|
AU US|CMCSA US|FB US|INFO US|MCO US|ORLY US|SPWH US|VRA US|
AVLR US|CMLS US|FIS US|INST US|MDCO US|OSK US|SRPT US|VRSK US|
Disclaimer: All information and data on this blog site is for informational purposes only. We make no representations as to the accuracy, completeness, suitability, or validity, of any information. We will not be liable for any errors, omissions, or any losses, injuries, or damages arising from its display or use. All information is provided AS IS with no warranties and confers no rights. We don’t know or understand the risk profile or time horizon of other investors so any information or opinions contained on this website are not intended to constitute a specific recommendation to make an investment. This blog is intended to share our opinions and not persuade you into to making specific investments. You need to do the homework yourself and make your own choices with your money based on your unique circumstances.