Is Market Timing worth the Effort?

"We continue to make more money when snoring than when active." Warren Buffett
"Far more money has been lost by investors preparing for corrections, or trying to anticipate corrections, than has been lost in corrections themselves." Peter Lynch
"In the financial markets, hindsight is forever 20/20, but foresight is legally blind. And thus, for most investors, market timing is a practical and emotional impossibility." Benjamin Graham
"We have long felt that the only value of stock forecasters is to make fortune-tellers look good." Warren Buffett
"Investing should be more like watching paint dry or watching grass grow. If you want excitement, take $800 and go to Las Vegas." Paul Samuelson
Market timing is a road which should not be traveled according to many investors we greatly admire. Yet we think that if done intelligently, it is a useful tool.
Market are (at least were) driven by human psychology. Emotions, the resulting reasoning bias and flaws, their tendency to influence behaviors in a predictable way, are driving the financial markets.
If you are not convinced we would recommend "The Crowd: a Study of Popular Mind" by G. Le Bon, C. Kindleberger's "Manias, Panics, and Crashes: A History of Financial Crises", the illuminating work of R. Shiller and D. Kahneman and many others.
We reject the inflexible efficient market hypothesis and lean toward A. Lo adaptive market hypothesis. It states that investors are mostly rational. Bias such as overconfidence, anchoring, loss aversion and confirmation need make them sometimes behave irrationally. It can also lead, by domino effect, to the whole market being driven by irrational behavior.
There are different ways to time the markets.
The most popular is to use binary signals to get in and out of the markets. The main problem is the high dependence on the parameters of such models.
Our approach is different. We see the markets as influenced by different actors with different investment methodology on top of the macro and behavioral cycle.
We can classify investors in 2 categories. The cyclically inclined who follows and pushes the upswing past their best due date and sell down to the low of a bear market, often panic selling at the end. The counter-cyclical investor which tends to sell rallies or when the market are too extended to the upside and buy the decline or the panic.
Those 2 categories can be divided into 2 sub-categories. The value sensitive investor who buys assets with a sufficient discount to their net present future cash flow (Margin of safety is the hype term) and the value insensitive to whom valuation is not a factor influencing their investment decision.
Value investors are counter-cyclical and value sensitive, while CTA, pure volatility targeting fund are cyclical and value insensitive.
Some investors can move from one category to the other depending where we are in the ebb and flow of the macro and behavioral cycle. The most advanced macro cycle are usually accompanied by the most extreme sentiment toward the markets.
At major bottoms, cyclical, trend-following investors dominate and the tide reverse thanks to the activity of the counter-cyclical investors. Extreme tops are the result of the selling of cyclical investors surprised by the depth of the decline they initially bought into. The selling last with some intermittent short-term rallies but without any real floor provided by value conscious counter-cyclical investors.
In order to be robust, a market timing meta-model needs to incorporate those elements. One need to understand how the various categories are positioned, what their sentiment is, where we are in the macro cycle and where will counter-cyclical investors start to exert their influence.
All of this has been challenging in the past few years, mainly in the US, due to the Pavlovian reaction of investors toward any Federal Reserve policy announcement and the hyper-sensitivity of the latter to any bout of volatility.
Beating Buy&Hold in the past few years, especially tech heavy market cap weighted indices has been challenging but it is not the purpose of market timing. Its purpose is not necessarily to beat the markets on a CAGR basis but to have at least a similar CAGR with much lower volatility and drawdowns or to put it simply, to provide peace of mind.
Enough ruminations, let's move to our model methodology.
The model contains 3 juxtaposed layers:
- Trend Determination Model (Tactical)
- Ebb and Flow Models (Warnings)
- Tail Risk Overlay (Tails)
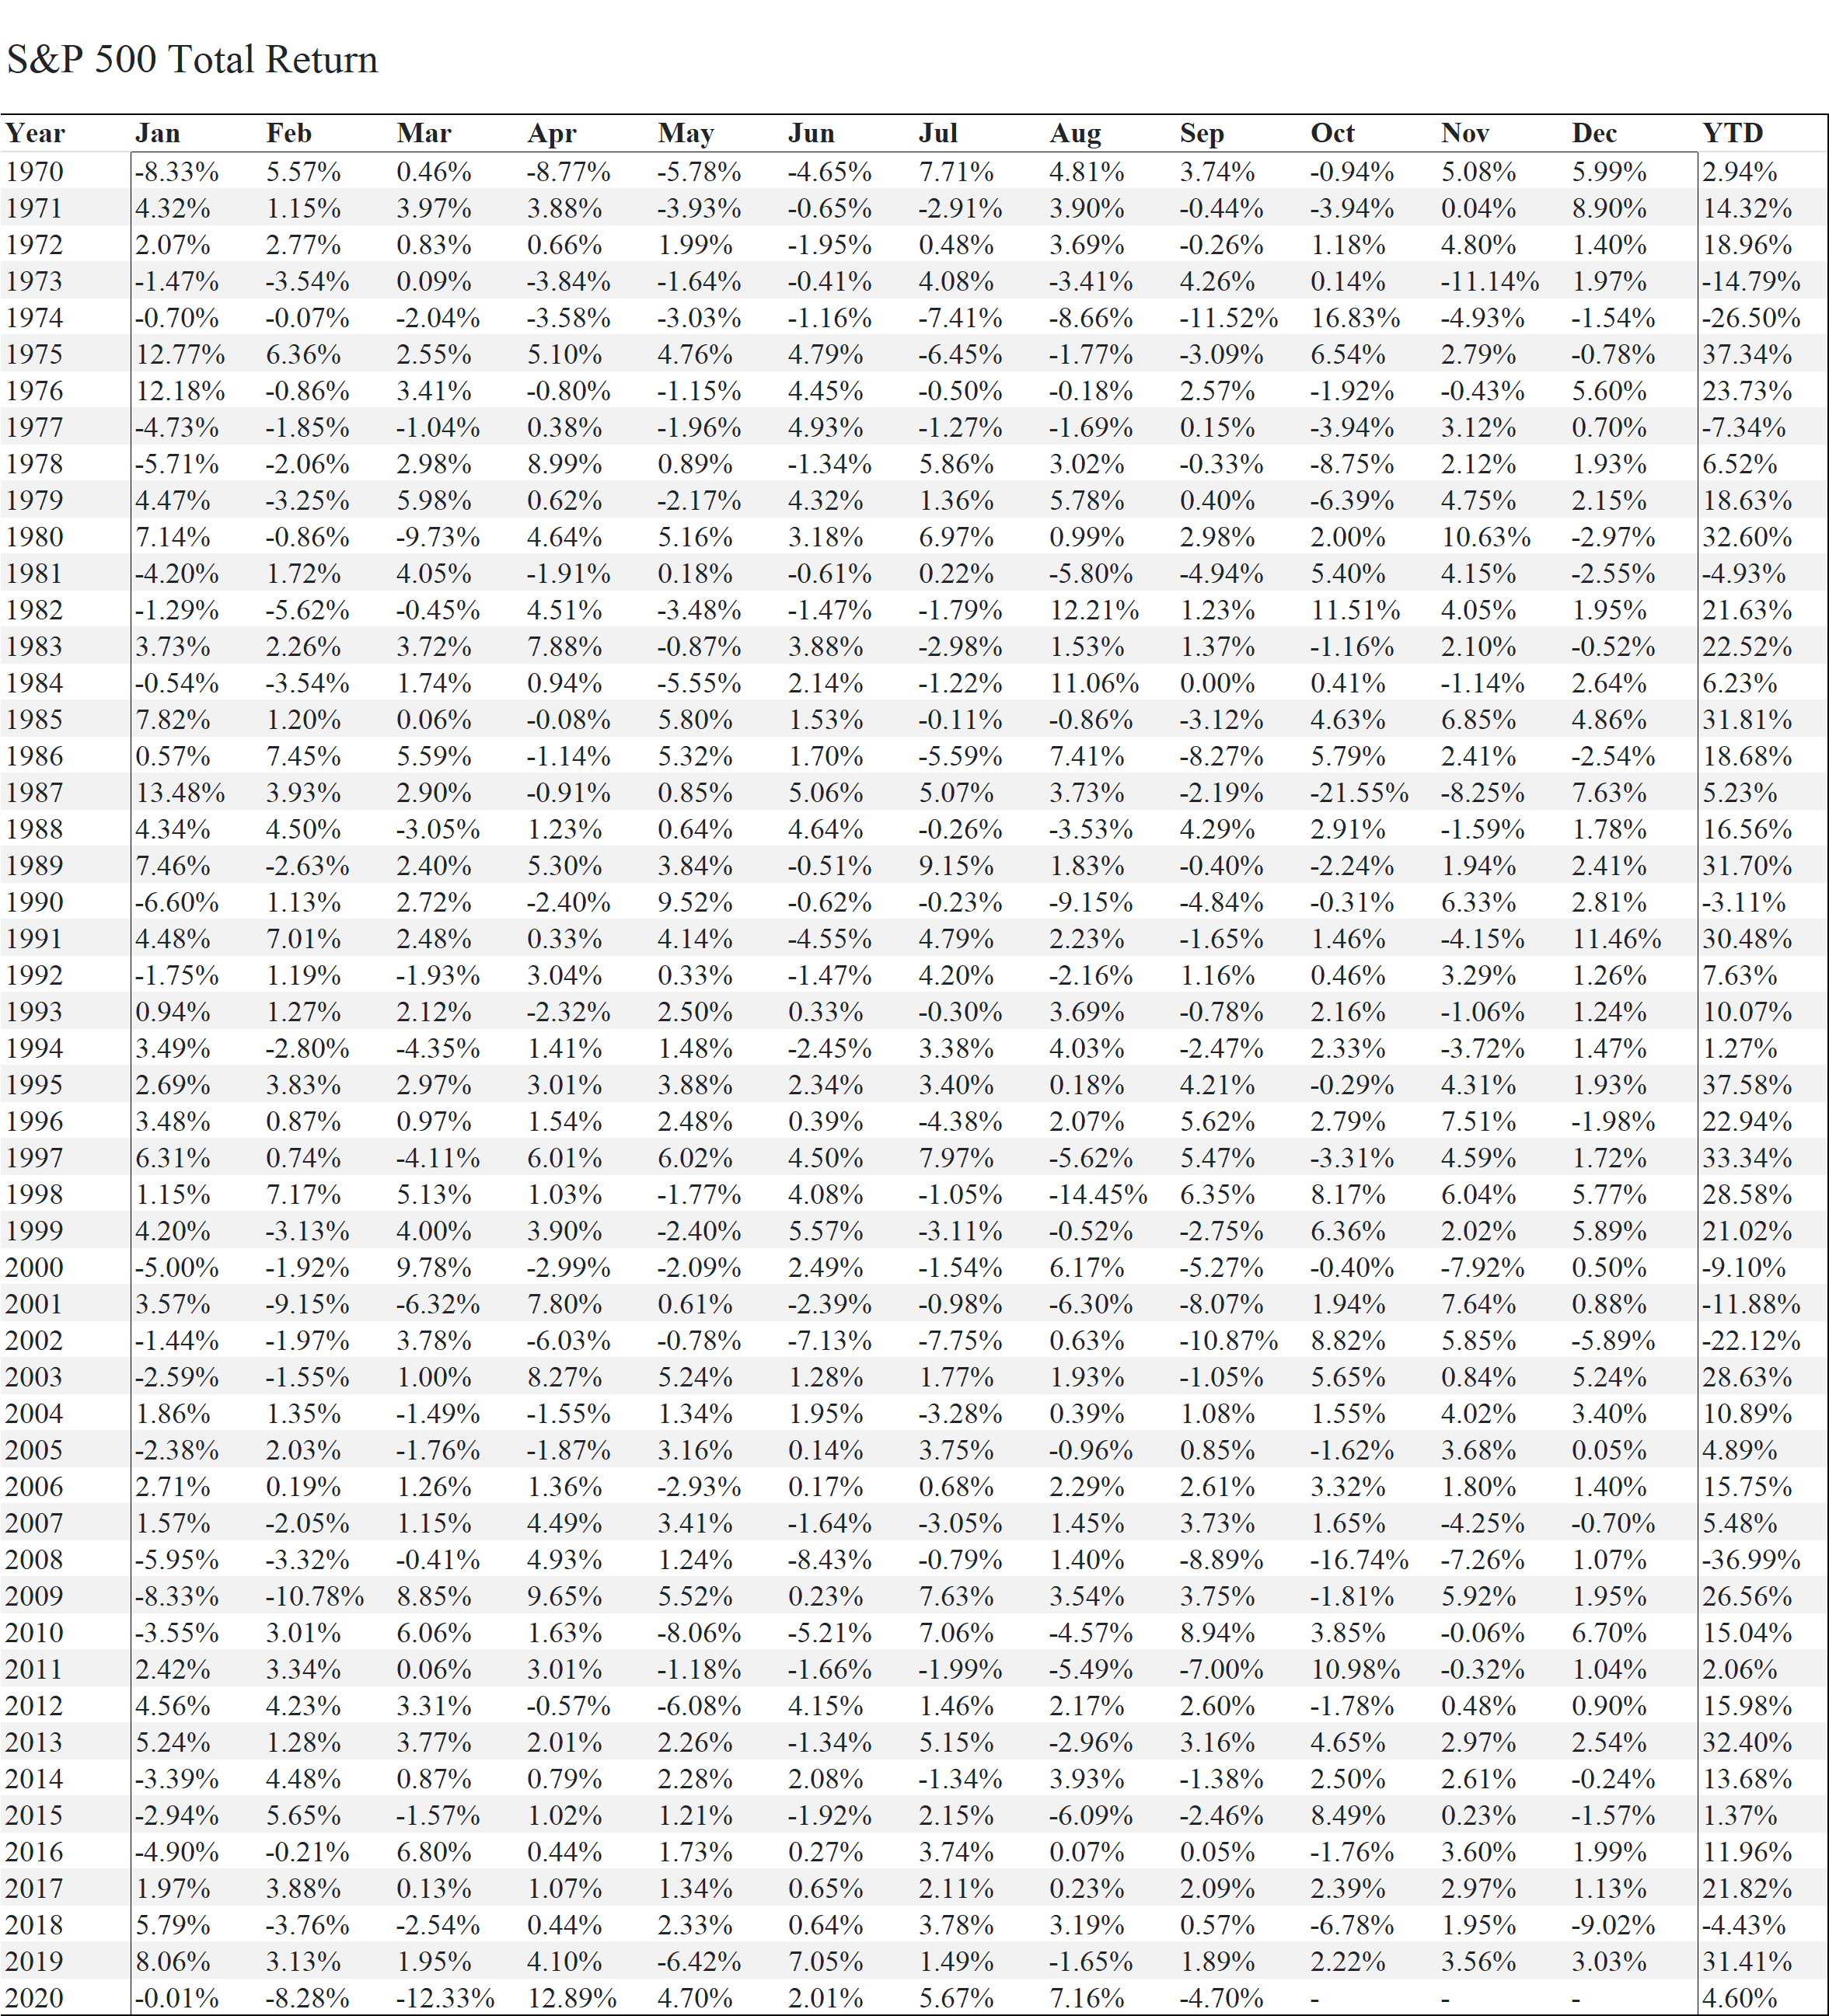
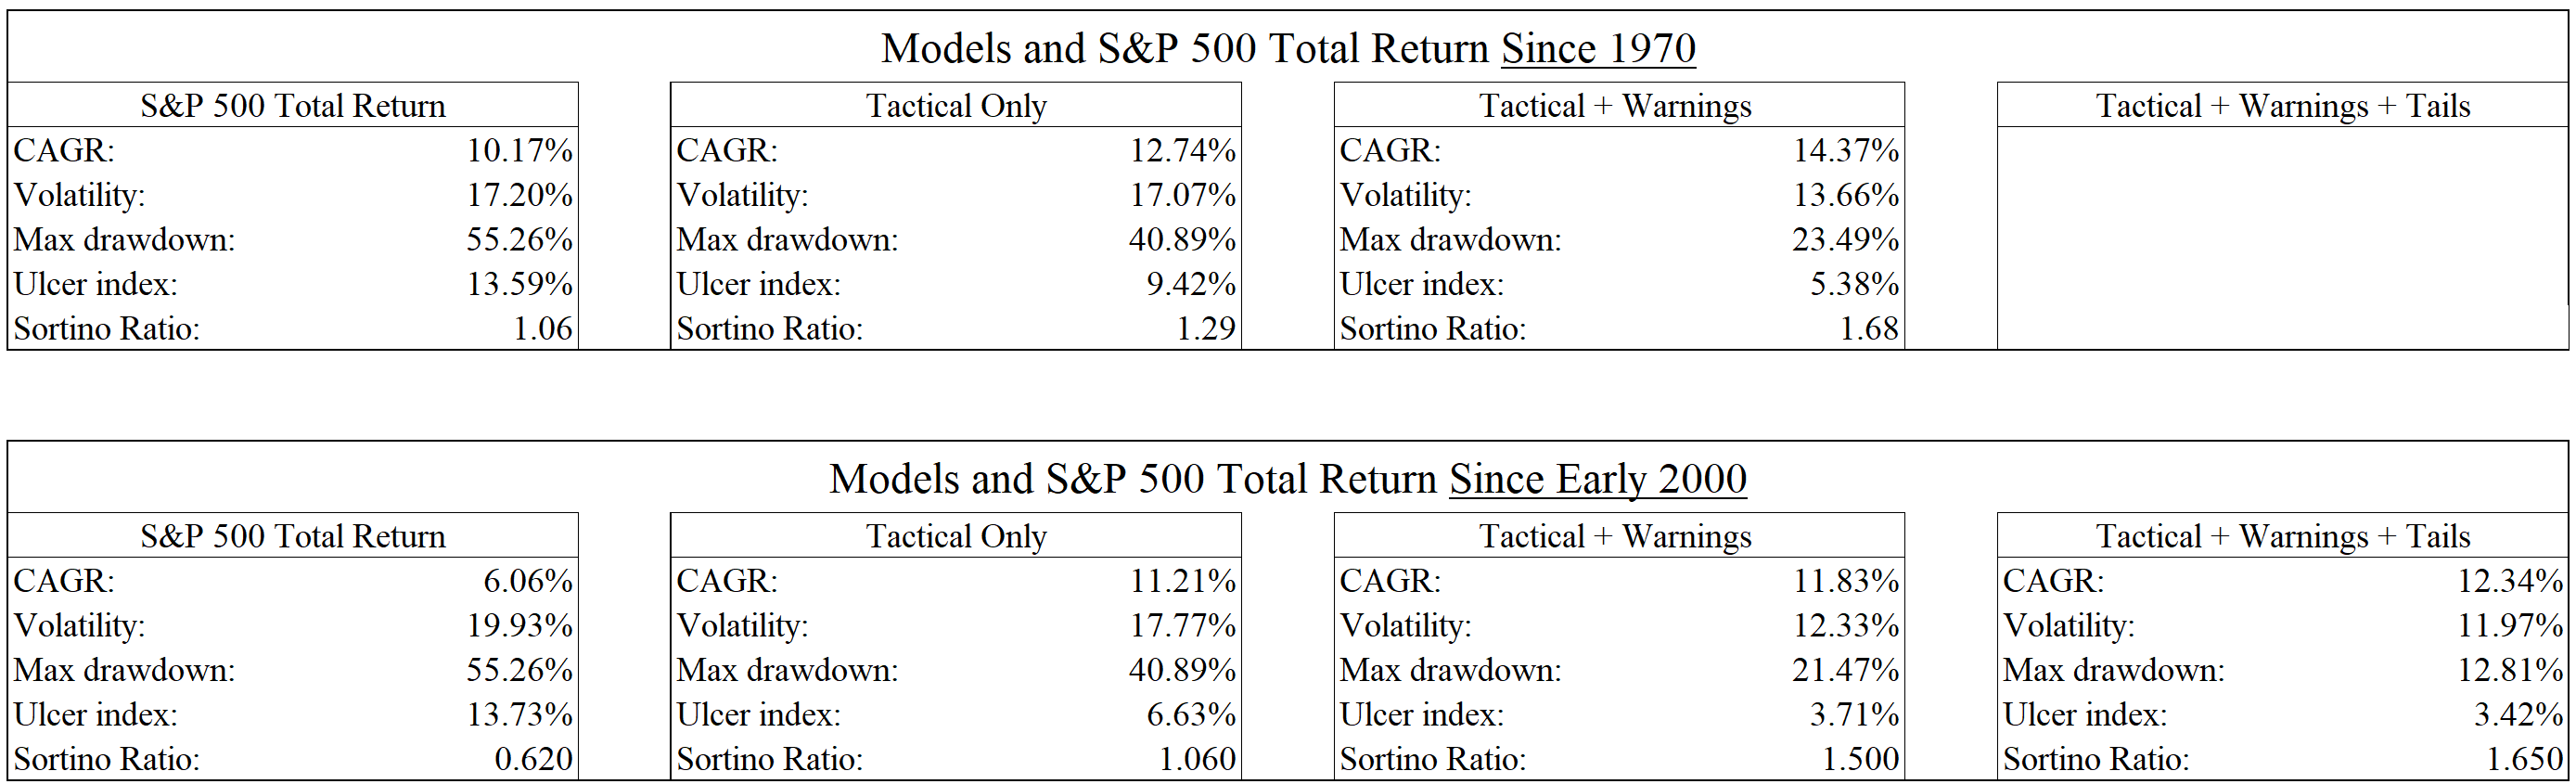
Before we start delving into the various parts, you will find below the results of simple models using the various outputs. We do not earn money on cash and the allocation can move from a low of 50% net short to a 125% net long position. We use the S&P 500 total return as a benchmark and as the timed index.


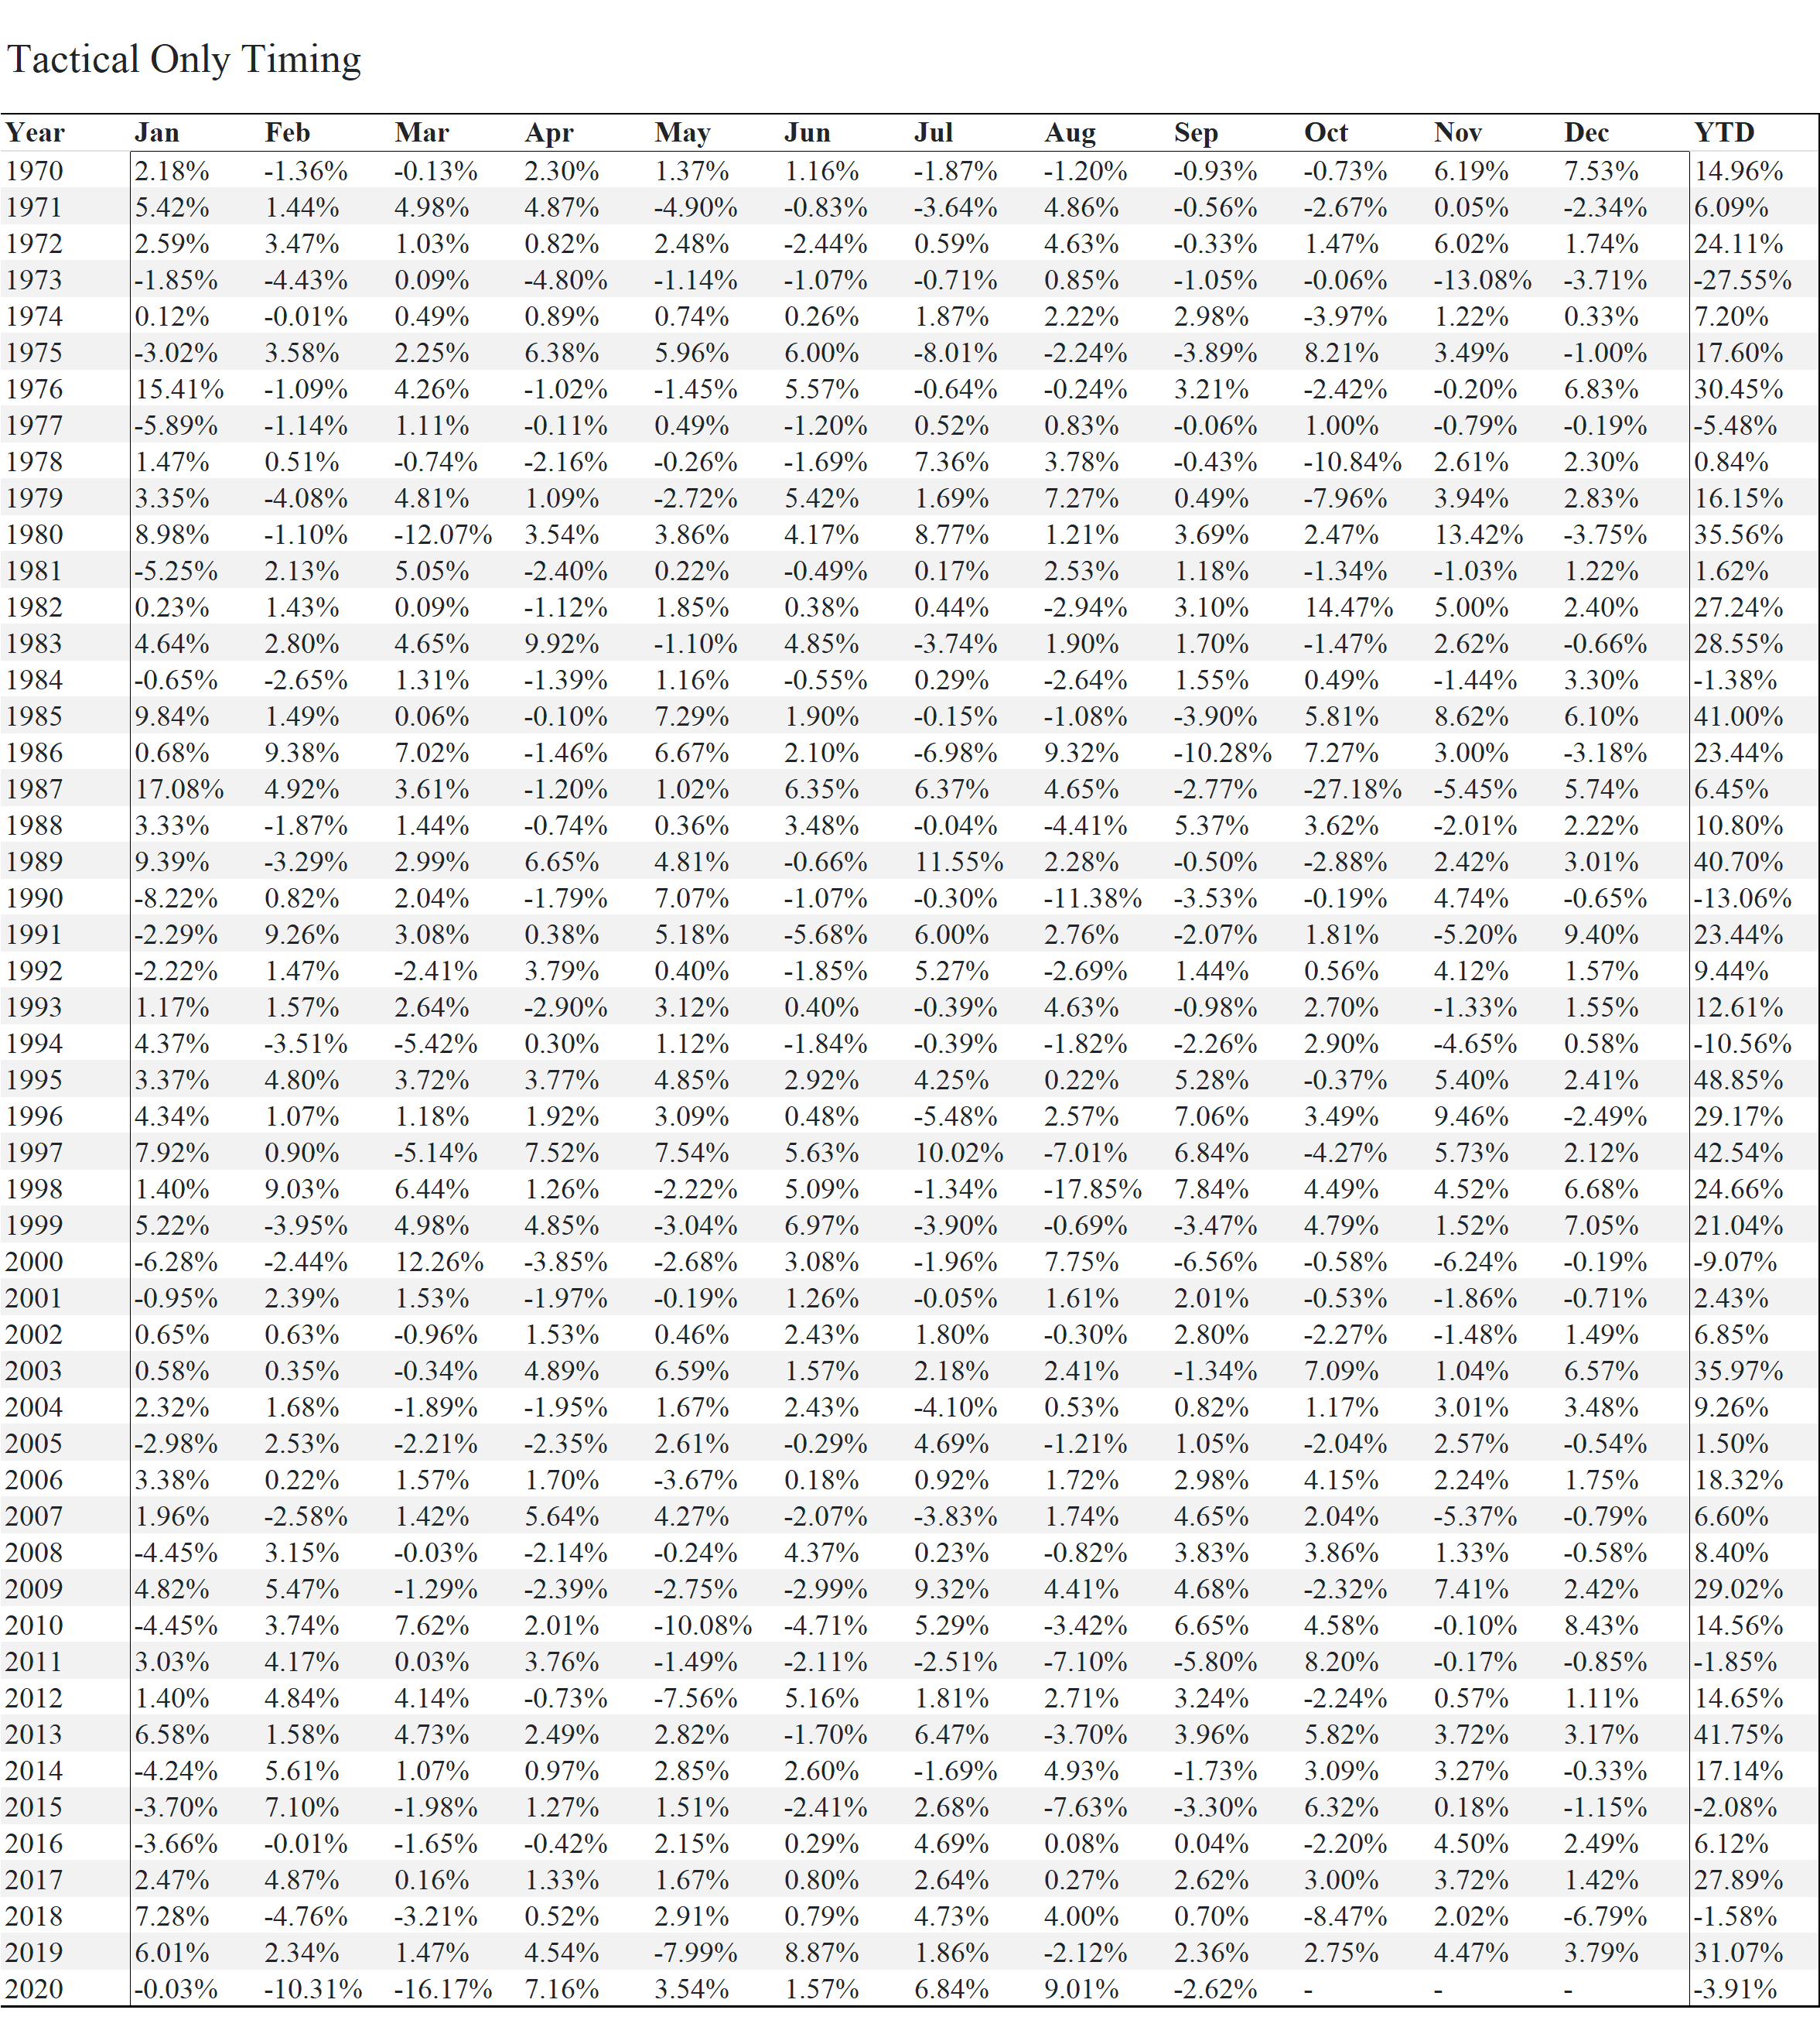
1. Trend Determination Model (Tactical)
The purpose of the Trend Determination Model is to put the 2 other layers in perspective. A market has not the same personality and reacts differently to various inputs in an up or down trending markets.
Ideally such models would only give a couple of signal every 4-5 years, the usual duration of an up-down cycle. A popular way to measure it is through the slope of the index 200 days moving average. It has worked reasonably well in the past. The problem is that it is entirely dependent on the 200 days moving average signal. As you may know by now, we always aim to be as agnostic to parameters as possible.
Our Trend Determination Model use around 20 models, based on distinct factors, to determine in which phase the market is. To do so we look at the percentage of models indicating an uptrend. A high number indicate a highly productive market, a low number the reverse. Productivity is meant as a high Sortino ratio.
The model sub-divise the market's behavior into 4 states, from very bullish to very bearish. As you will see below, the 2 other layers allow the market's behavior to be further classified as neutral
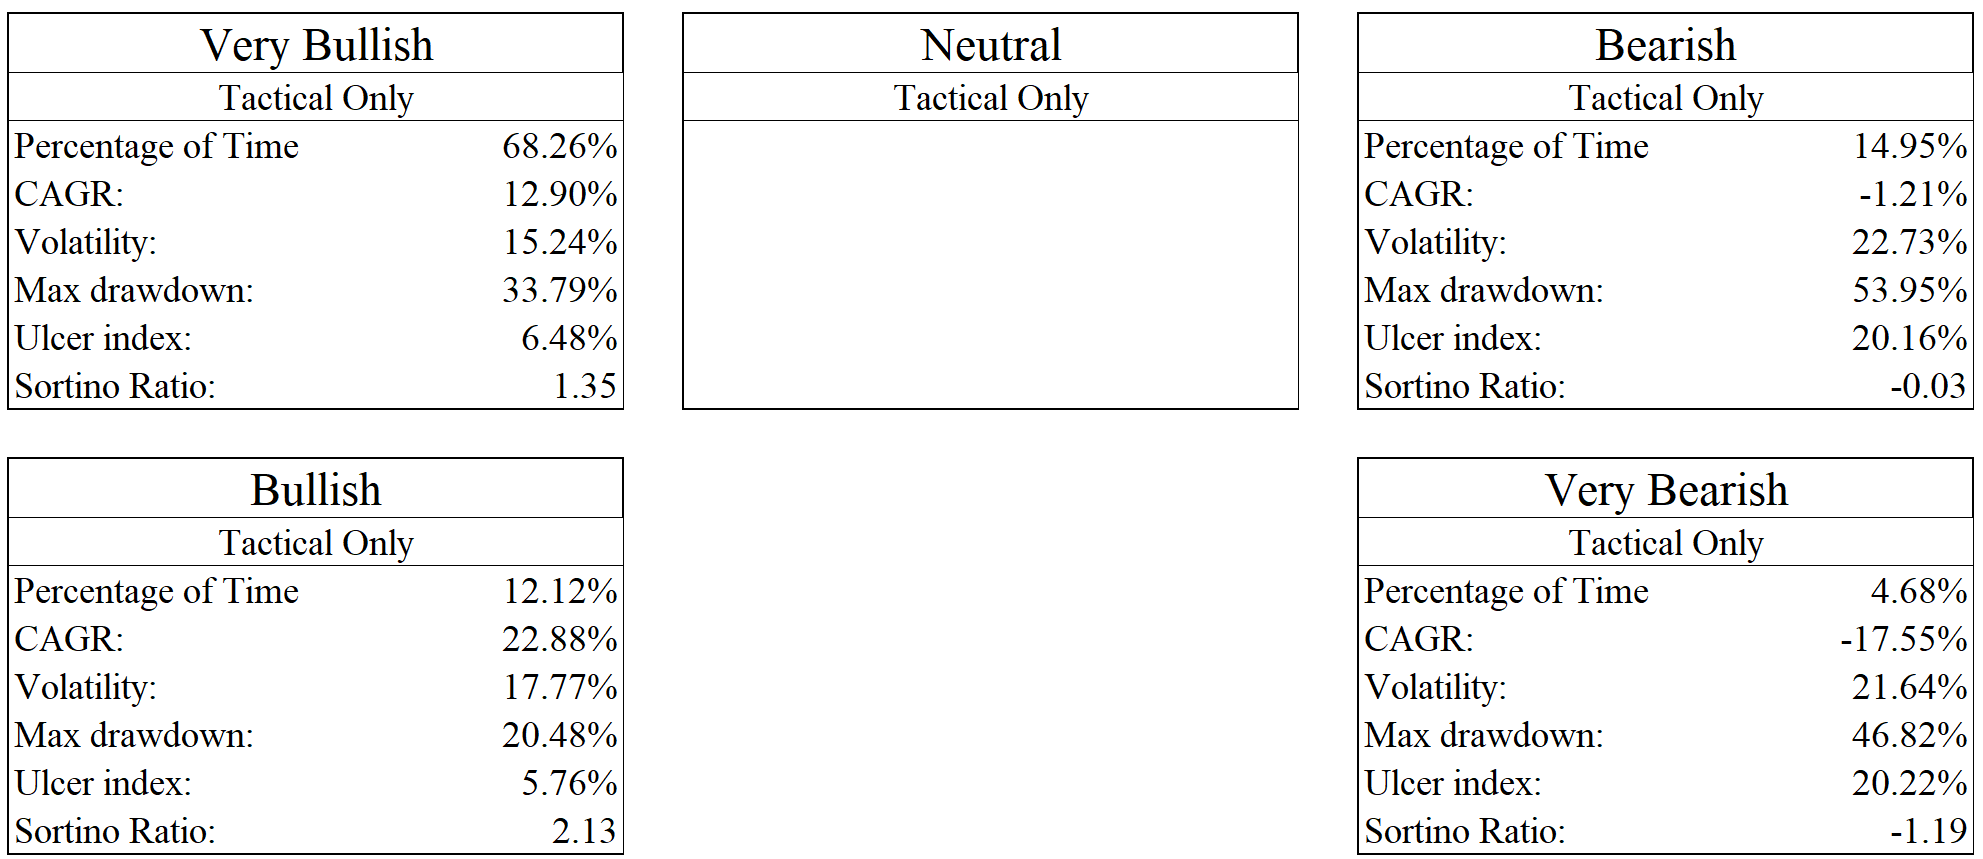
The market is classified as Bullish or Very Bullish 80% of the time which corresponds to approximately the time the market has spent in a bull market historically. You will also notice that the market performed better during the Bullish than the Very Bullish periods. When building models we always lay out the rationales of why it should work and how it should work. We won't change a classification because it does not behave exactly as expected.
Anyhow you can see that the model has been effective in classifying the bullish and bearish phase and our simple models using this signal has outperformed the market since the early 70s by more than 2.5% per year with less volatility and a smaller drawdown.
Nonetheless, it can not protect investors from sudden declines while the market hasn't shown sign of price weakness before. The crash of 1987 and the recent decline in February-March this year are painful demonstrations.
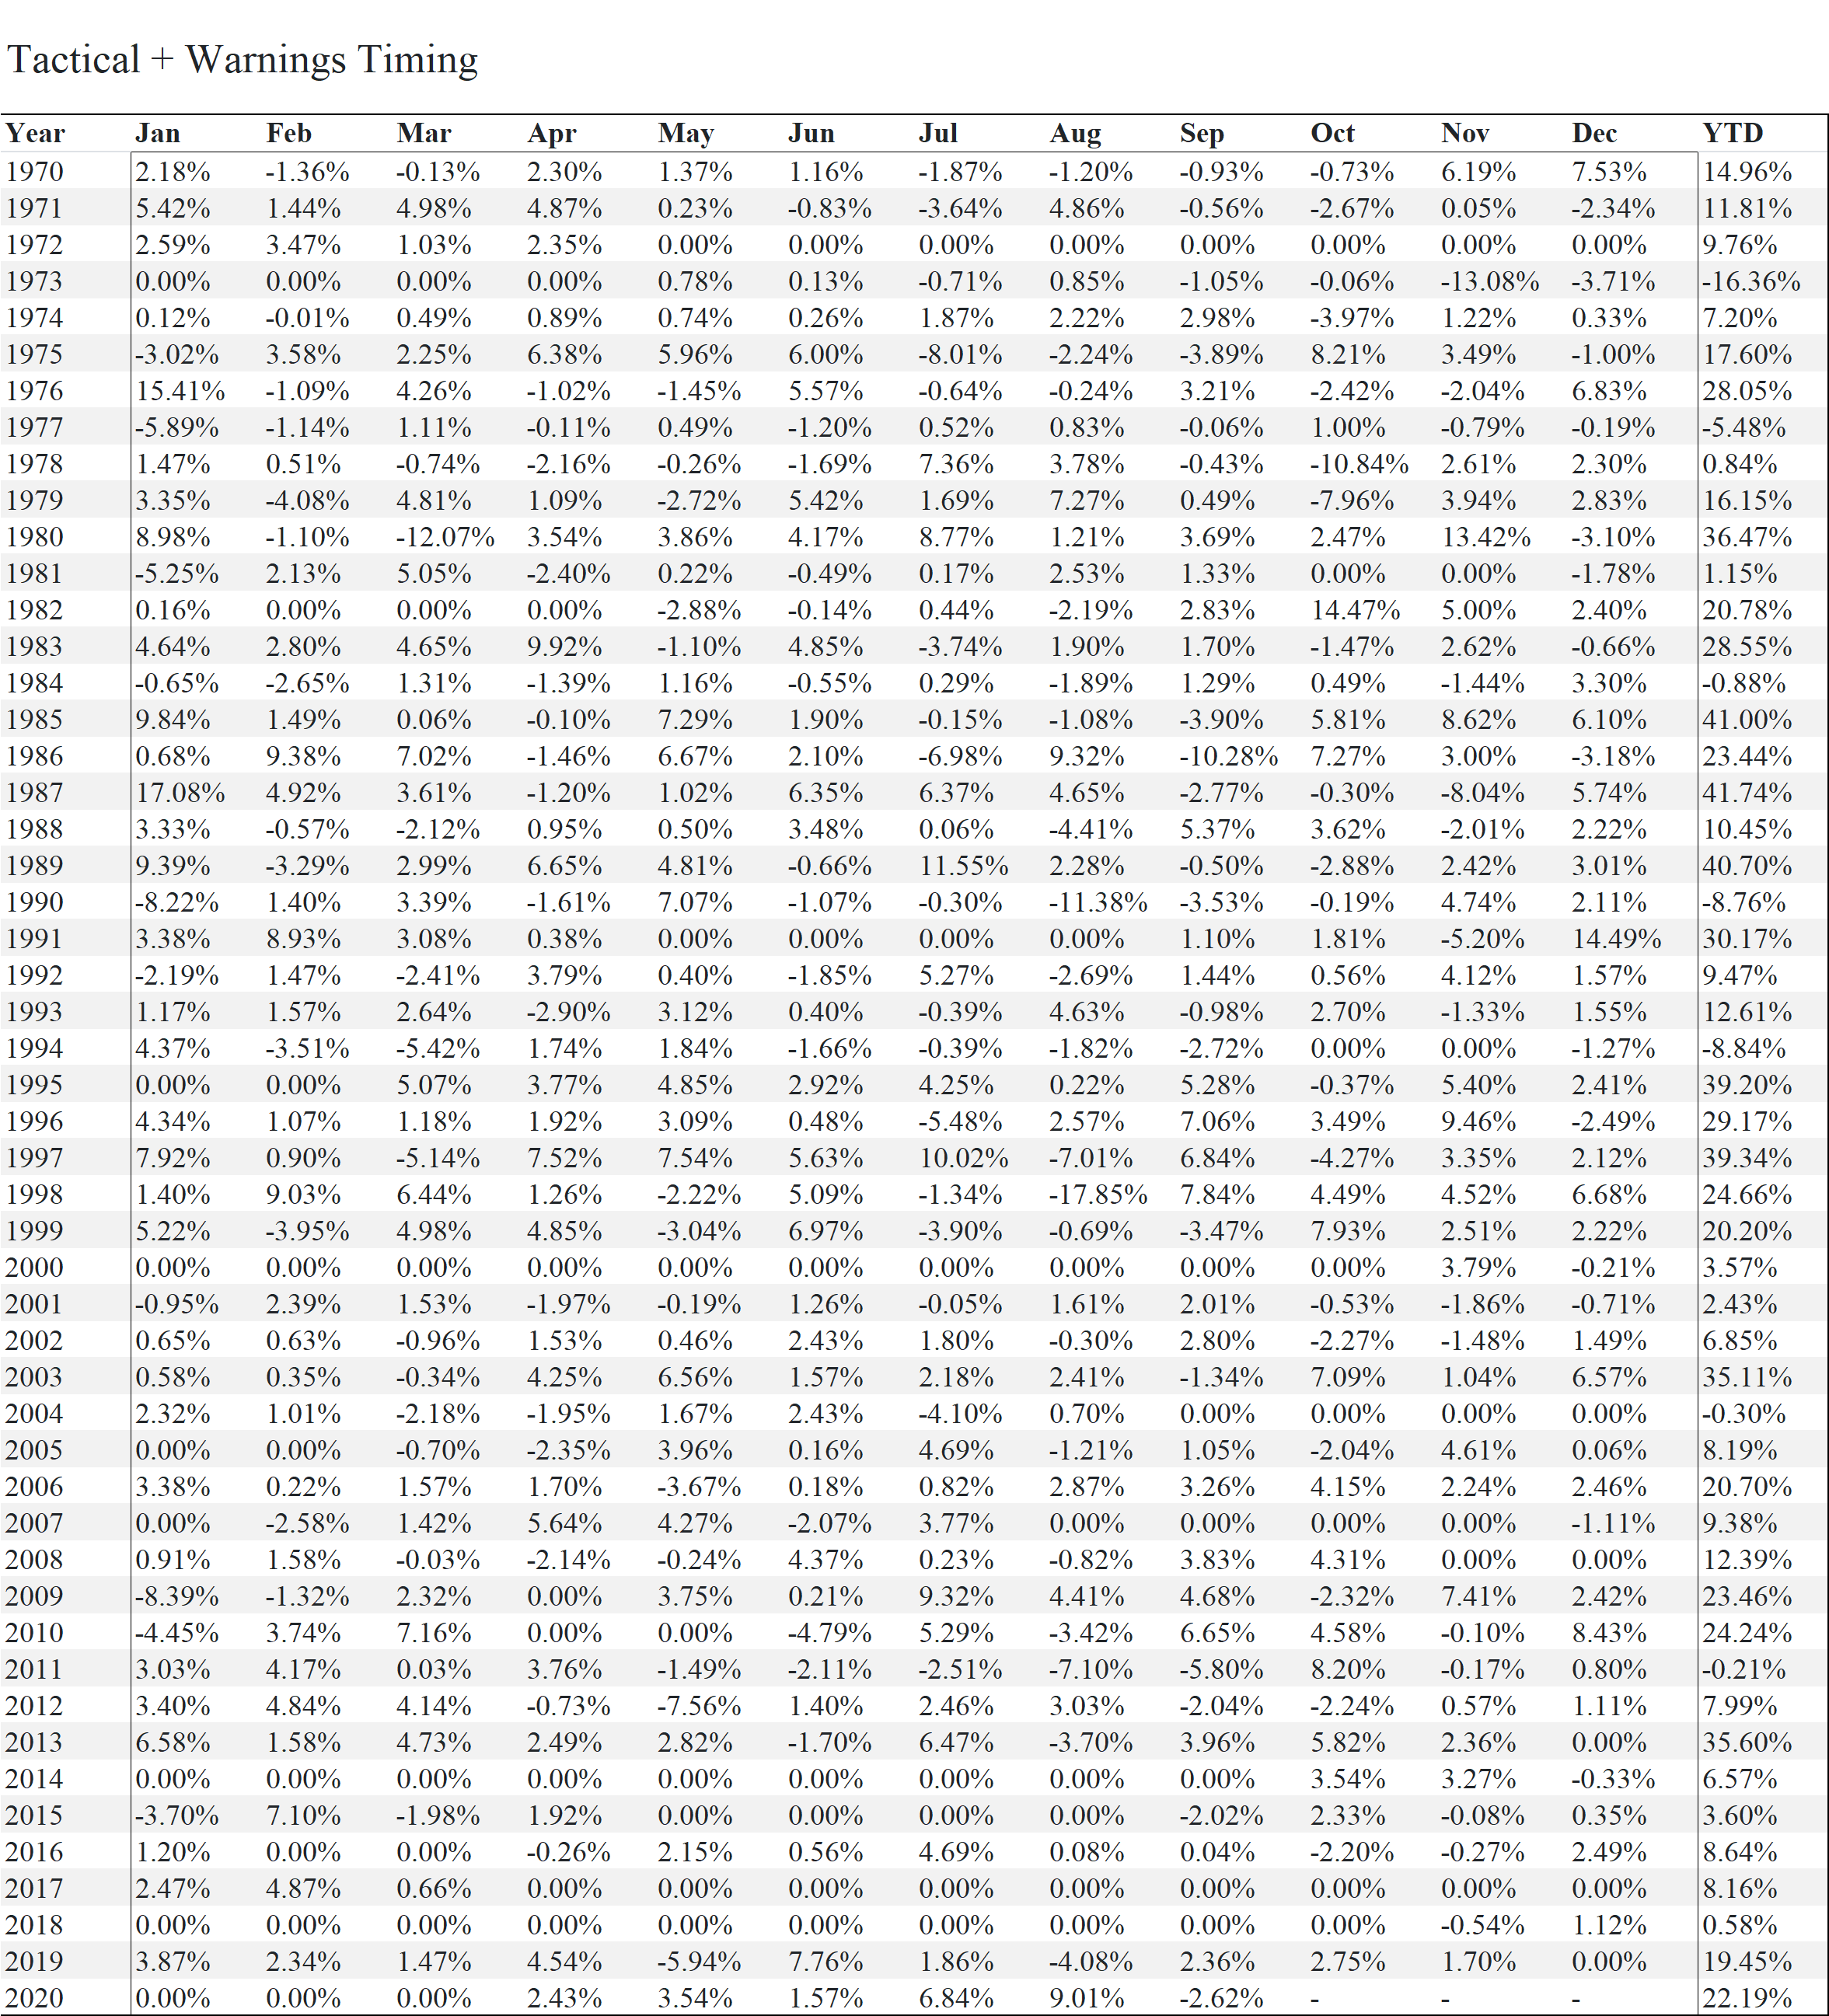
2. Ebb and Flow Models (Warnings)
Markets trends but trends are not linear. Our next set of models are trying to identify those ebbs and flows around the major cycles.
To do so we have selected hundreds of indicators to study if what we think they would forecast, actually happened. They were classified as having:
- Short-term predictive power (less than a month)
- Medium-term predictive power (between 1-3 months)
- Long-term predictive power (between 3-12 months)
We had 3 further categories to gauge the probability of a cyclical trend change:
- Major-top models
- Downside capitulation models
- Thrust models
Those models almost never change the tactical model allocation from long to short or short to long but they modulate the allocation, decreasing it when indicators are indicating a high probability of decline.
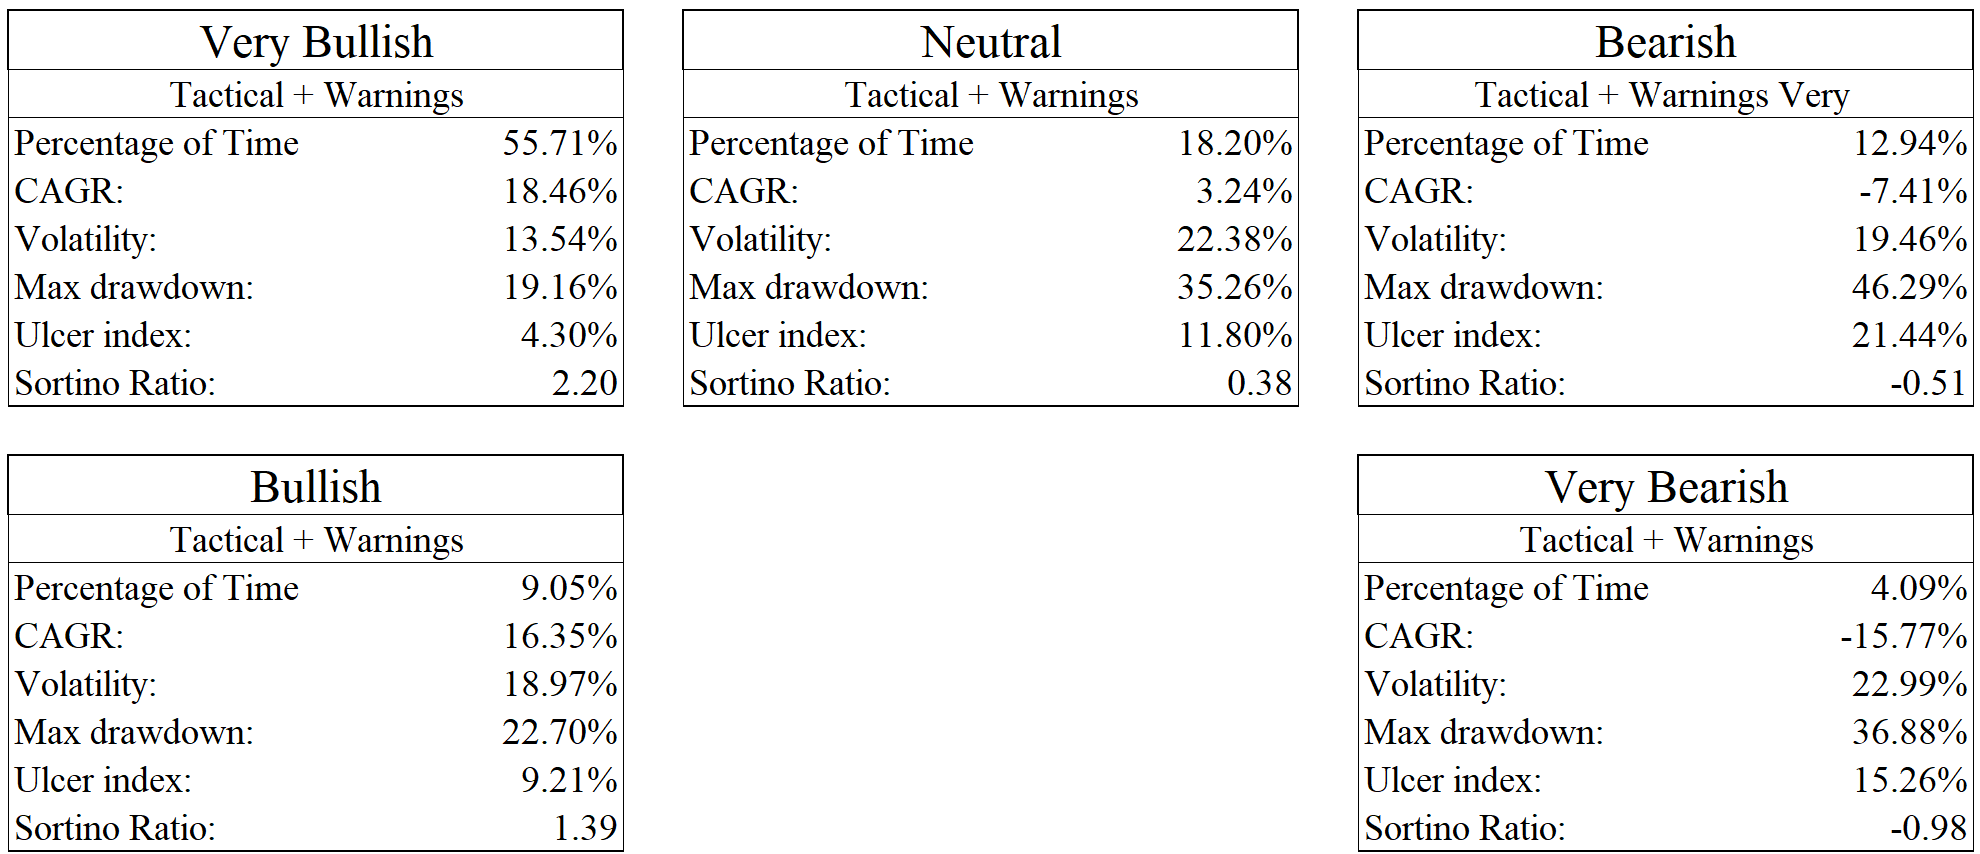
The Bullish classifications are now around 65% and the Neutral phase is introduced. The 3.24% return during the latter is below what an investor would have earned in cash during those period.
As can be seen from the table the model is working as it should with a linear decline in the market Sortino ratio from the very Bullish to the Very Bearish quadrant. Our simple timing model has furthermore added more than 1.5% CAGR to the first layer and lowered the volatility and the maximum drawdown significantly.
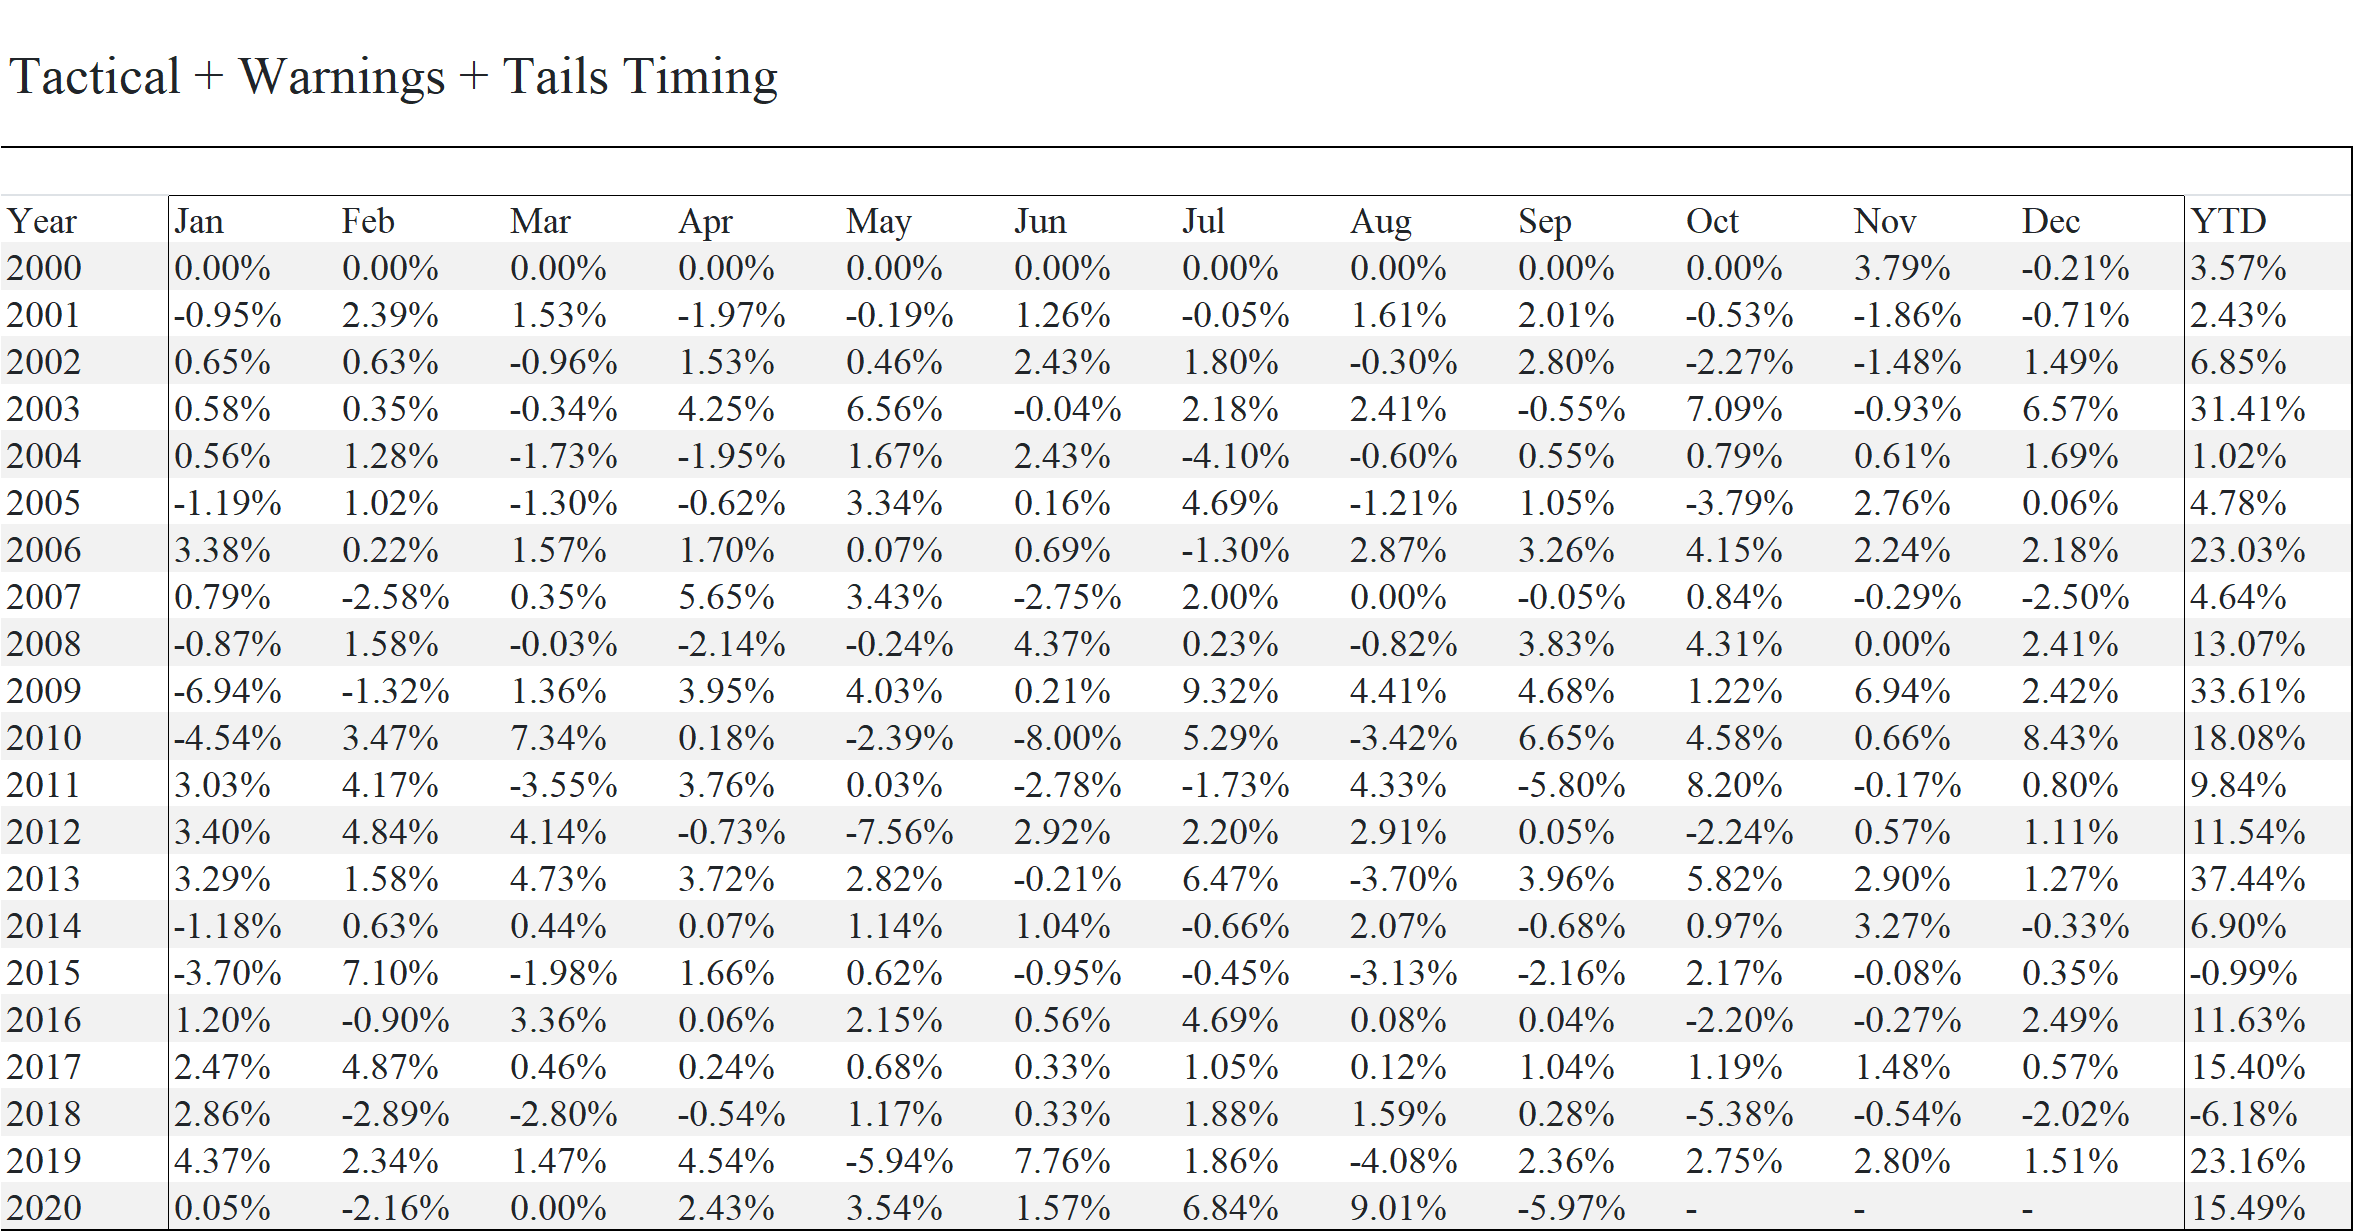
3. Tail Risk Overlay (Tails)
One would think that the first 2 layers would be sufficient but they are not. Indeed, they are incapable of protecting an investor in a "Waterfall" decline. Waterfall declines are characterized by deep, sudden and persistent market declines, usually from already very oversold levels.
In this configuration, if the first layer is in bullish mode, there is a high probability that the second layer will indicate the need to get longer the more the market decline (if the first layer turn negative this would change).
Our Tail Risk Overlay, when triggered, will simply put us to cash, if the signal of the second layer is to be long. If the signal of the second layer is to be neutral, we allow a small long position with the third layer if our model do not identify a risk of tail event.
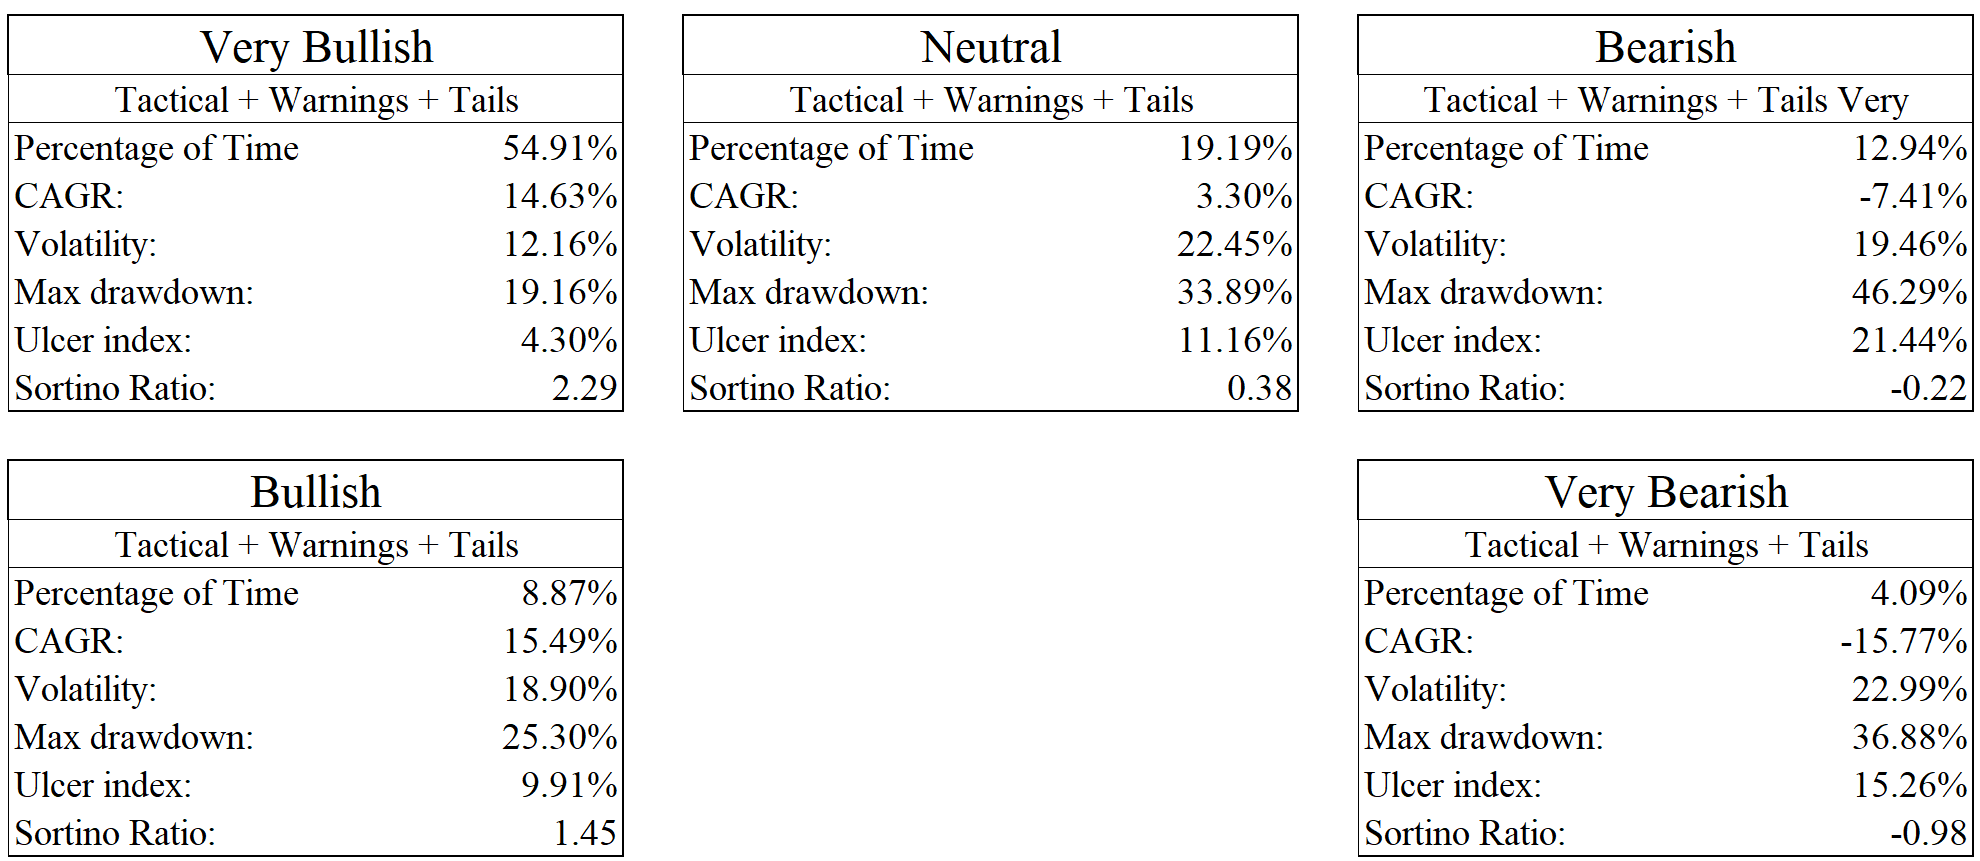
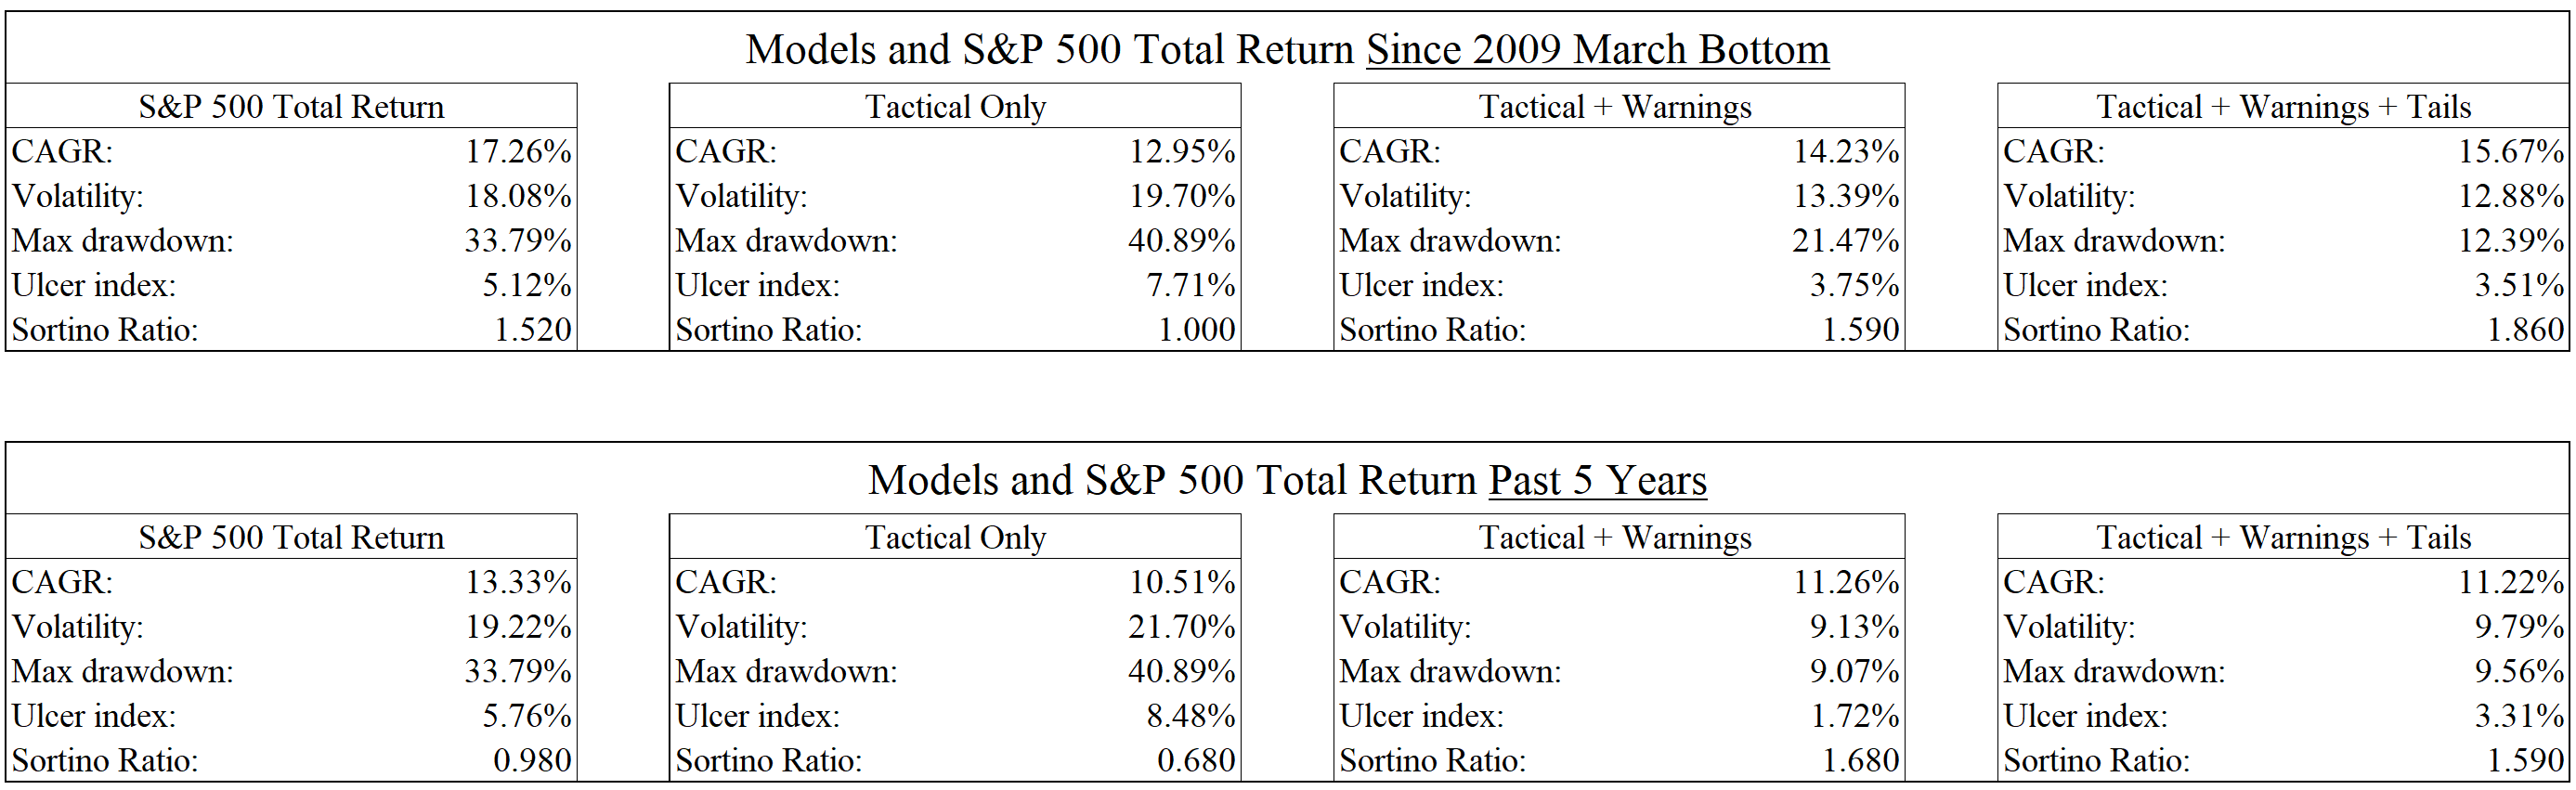
We only have a sufficient data set for the Kill Switch since early 2000. One can see that the neutral classification has increased at the expense of the Bullish and above one.
We see the same linearity in the decline of the Sortino ratio as in the second layer. The simple timing model only increase the CAGR of the second layer by 50 bps and lower the volatility marginally since 2000 but the maximum drawdown is cut by almost 10%.
Many doubt that timing the markets successfully is possible but we are convinced it is. Using only common sense we were able to come up with our methodology more than 10 years ago (the methodology is traded live since September 2006).
The simple implementation of the signal presented in this article can be improved with the use of options and/or investment in other assets when cash is available. The buying of very deep out of the money puts for example, when the Tail Risk Kill Switch triggers.
The only two things to remember which should be the basis of any attempt to time the markets are:
- Market trends but those trends are not linear.
- Sometimes decline do not simply stop when the market become extremely oversold.
In the future, we will show how the models work on our enhanced indices and our US Sentinel Model. We will also show how it can be used in asset rotation models to lower their volatility and the depth of their drawdowns and how valuation can be integrated into this framework
Thanks for reading.
As always, we encourage readers to subscribe to our mailing list to get new articles as soon as they are published. We also appreciate your questions and commentaries which are helpful and have lead to thoughtful exchanges. They can be sent to research@nava.capital
We have also put online some of the internal tools we used to generate the equity curves, statistics, factor attribution and others we use in our article.
Feel free to use them. If you wish enhancements you can reach us at tools@nava.capital
Monthly Tables