Art unit'd kingdom equities cheap'r than their unit'd states counteth'rparts and art they a valorous relative buyeth anon?

In December 2021 we wrote an article with the title “US Market Valuations: Looking down the Abyss!” where we came to the conclusion that the US S&P 500 was unlikely to generate positive real total return during the next 10 years.
The article can be found on LinkedIn and our blog.
In this short article we will analyze the UK equity markets valuation.
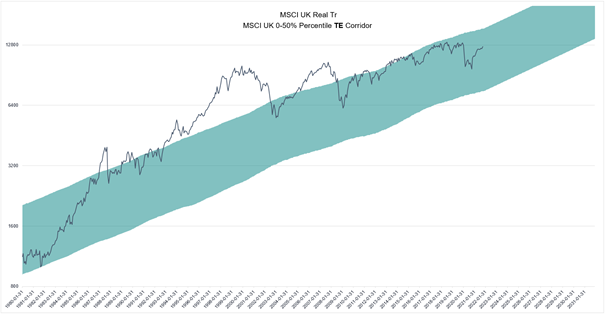
Because it is quite difficult and very time consuming to find reliable long-term data to utilise in a long-term analysis using the Margin Adjusted Price Earning we will use a smoothed version of Shiller Cyclically Adjusted Earnings (TE).
The outcome of the analysis by utilizing the MSCI UK index (the ‘Index’) is that the UK markets should revisit the 50th percentile of its Price to TE ratio (top of the channel) in the next 10 years. Real annual total return should be around 10% if it happens 5 years from now and 8% if it takes 10 years (it doesn’t imply that the market can decline substantially in between).
Would you rather be long US or UK equities from here?

The message is similar if one looks at relative (UK vs US) Price to Sales ratio (top panel).
Higher profit margins justify a higher Price to Sales ceteris paribus, but relative margins (bottom panel) are at levels which would only imply a 20% discount for the UK, not a >50% one.

If one worries about the exchange rate, the British Pound is relatively low when looking at the BIS Real Effective Exchange rate (we will present our currency valuation framework another time).

Finally, if we look at the relative total return curve, we can see that after having underperformed by more than 60% during the past 15 years, the UK markets could be starting to reverse the trend.

So would you rather be long US or UK equities from here?
Since the launch of the Strategy in 2015, The Sentinel UK long only has outperformed the FTSE 100 Index by mid to high single digit annually while the long/short version (using FTSE 100 futures for the short side) has outperformed by low double digit annually.
You can find a brief introduction to our Sentinel country/region strategies here.


About us:
NAVA Capital SA (‘Nava’) is a Swiss based advisory firm. It is a spin-off of a large Swiss single Family Office and it has developed since 2005 several proprietary quantitative strategies under active use, managing significant amounts of money.
Kroma Capital Partners Ltd. (‘Kroma’) is a Dubai based, DIFC incorporated - DFSA regulated entity holding a Category 3C license. This license allows Kroma to Managing Assets, Holding and Controlling Client Assets, Arranging Credit & Advising on Credit, Advising on Financial Products and Arranging Deals in Investments. As a distributor we have advised clients on funds and bespoken solution since 2017 with assets raised > 1.3 bn $. As an adviser we advise 3 investment vehicles: a fund of private markets funds, a volatility fund of funds and a US long/short equity fund.
Nava and Kroma have entered into an exclusive partnership offering quantitative investment solutions under the Sentinel Family of Strategies. We offer institutional investors solutions with our Sentinel Gurus US Long/Short strategy, our Sentinel Enhanced Long/Short indices strategies (which can be run on any sufficiently large stocks universe), our asset rotation strategies and our volatility strategy. All strategies are highly liquid and offer full transparency and Mark-to-Market pricing.
Bespoke investment solutions are available as:
· AMC’s on the UBS Platform
· European Funds under the OpenFunds SICAV AIF / UCITS
· Cayman Funds (exp. 2022)
If you are a qualified or an accredited investor and want more information on the above, you can contact us at:
contact@nava.capital
If you have any comments on this article, you can contact us at:
blog@nava.capital