US Market Valuations: Looking down the Abyss!
“Value investing is at its core the marriage of a contrarian streak and a calculator.” S. Klarman
“The first principle is that you must not fool yourself, and you are the easier person to fool.” R. Feynman
In this brief note, our goal is to show readers, as objectively as possible, the current discrepancy between the intrinsic and the current value of the S&P 500.
Our conclusion is that the S&P 500 is not likely to have a positive nominal total return in the next 10 years and a ‘miracle’ would be needed to achieve positive real total returns. Central Banks have brought forward future equity returns (and some more) with their accommodative policies and hyper-sensibility to downside volatility.
Being blunt we would be surprised if the S&P 500 does not revisit at least the 2020 lows in the coming years.

When equity markets seem unstoppable, rising relentlessly on good, bad or no news, investors slowly forget that value is an anchor to price.
When markets have been quasi-invincible for more than a decade, with every decline recouped extremely rapidly, investors stop thinking critically.
Reflection becomes a liability. The educated fools are in control.
Buy the Dips works so well, let's build a narrative around it, let's create new viral acronyms, BTFD, FOMO, HODL,...
This time it is really different! Is it?
Central Banks around the world, by lowering interest rates aggressively and providing unlimited support, verbally and/or materially, to the markets at the slightest emergence of stress and by taking too much time or even refusing to remove the accommodations they provided, have set the stage for historical markets and social dislocations.
If one add that a chunk of the post-Covid fiscal spending largess going directly to the equity markets through gamified trading applications or passive mom and pop vehicles or the emergence of the YOLO meme/life mantra you have all the ingredients for a massive speculation frenzy.
When finance dominates everything, when companies' management are obsessed by financial engineering and short-term personal rewards, when governments/central banks/regulators are controlled and not controlling, dogmatic and not pragmatic, the end result cannot be good.
While we will expand on this in another article, Ben Hunt of Epsilon theory has written extensively and brilliantly on the subject. One could start here.
Bubbles need leverage to expand.
Interest rates below a certain level probably have a detrimental effect for the real economy as investments in new productive capital become less and less elastic to rates as they decline toward 0%.
Zombie companies survive, preventing any Schumpetarian creative destruction, leaving excess supply in place, pushing inflation rate down (what? low rates could be deflationary?).
Furthermore, savers are forced to spend less unless they take more risk as their fixed income portfolio doesn't generate much of an income.
The only thing striving is finance where actors put on more and more leverage to buy existing capital (buybacks, M&A, dividend payment to private equity firm, etc).
The sad consequence is a larger stock of debt unbacked by new productive capital.

A system where overall debt cannot be repaid, ever. A system where the can is kicked down the road until it can't anymore.
The end game is either an inflationary burst to save the debtors, a multi-decade's slow growth environment or a deflationary burst.
Given that the debtors are governments, interest groups lobbying them and Generation X and the younger ones (who will soon dominate the electorate), we have little doubt that the inflationary scenario is the most probable by far.
But let's come back to the main subject of this article, the US equity market valuation.
Stocks are a claim on a expected future stream of cash flows. To assess this stream's value today, we have to calculate its present value using an appropriate discount rate. This present value is called the intrinsic value of a stock or of a group of stocks.
At a given discount rate, the short-term fluctuations of cash flows have very little influence on intrinsic value. Remove entirely 1 or 2 years of cash flow and the difference will be small.
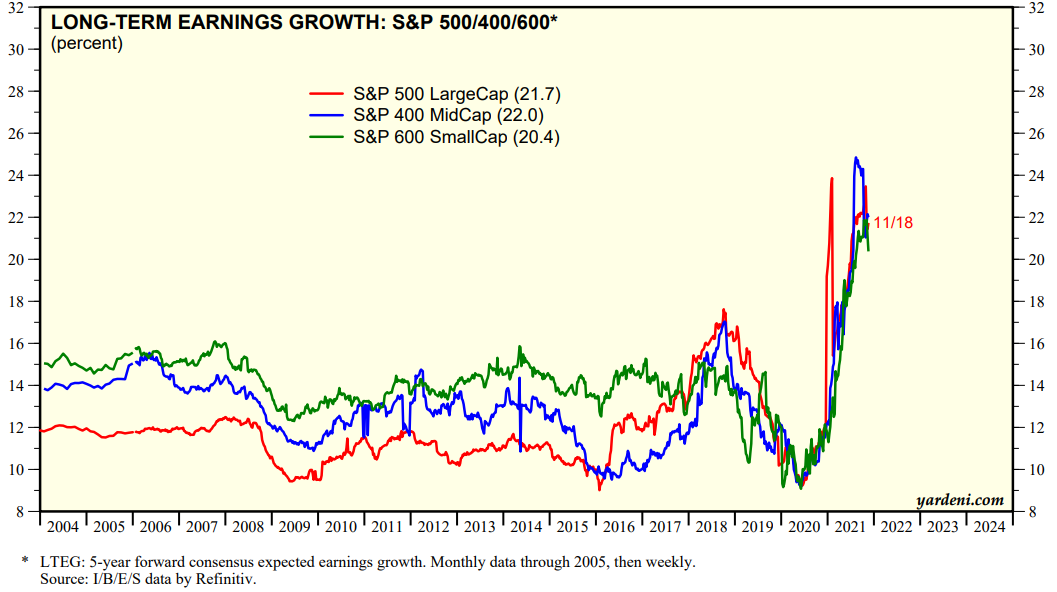
Longer-term expectation, on the other hand, have a large impact. Those expectations are highly pro-cyclical. As can be seen below, courtesy of E. Yardeni, analysts are today expecting earnings to grow more than 20% annually during the next 5 years. Earnings are already, as we will shortly demonstrate, well above trend and, therefore are highly likely to grow less than the overall economy. Still betting on 20%+ growth?
Changing the discount rate can have a huge impact.
Discount rate assumptions backed by market participants are strongly correlated with their mood. Bullish participants will accept a lower discount rate, ceteris paribus.
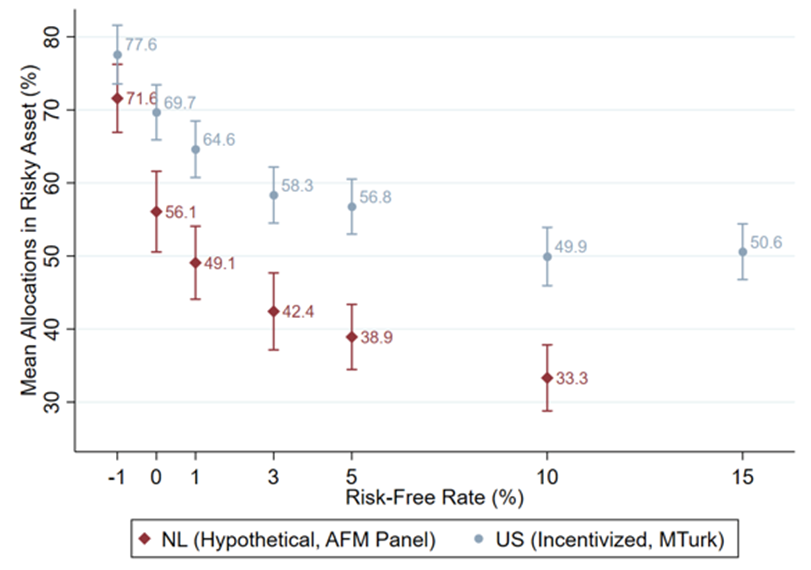
Prevailing interest rates usually serve as a loose anchor to discount rate assumptions. We can nevertheless see, experimentally, an increased exposure to risky assets the lower the risk-free rate is, even when the mean excess return is the same.
On the graph below, one can see the average allocations to a risky asset across different interest rate conditions. Each condition has 200 participants, from the MTurk platform. The x-axis shows the risk-free rate in each condition. The mean excess return on the risky asset is 5% in all conditions.
The current environment of extreme bullishness combined with low (0%) short-term rate is an explosive combination.
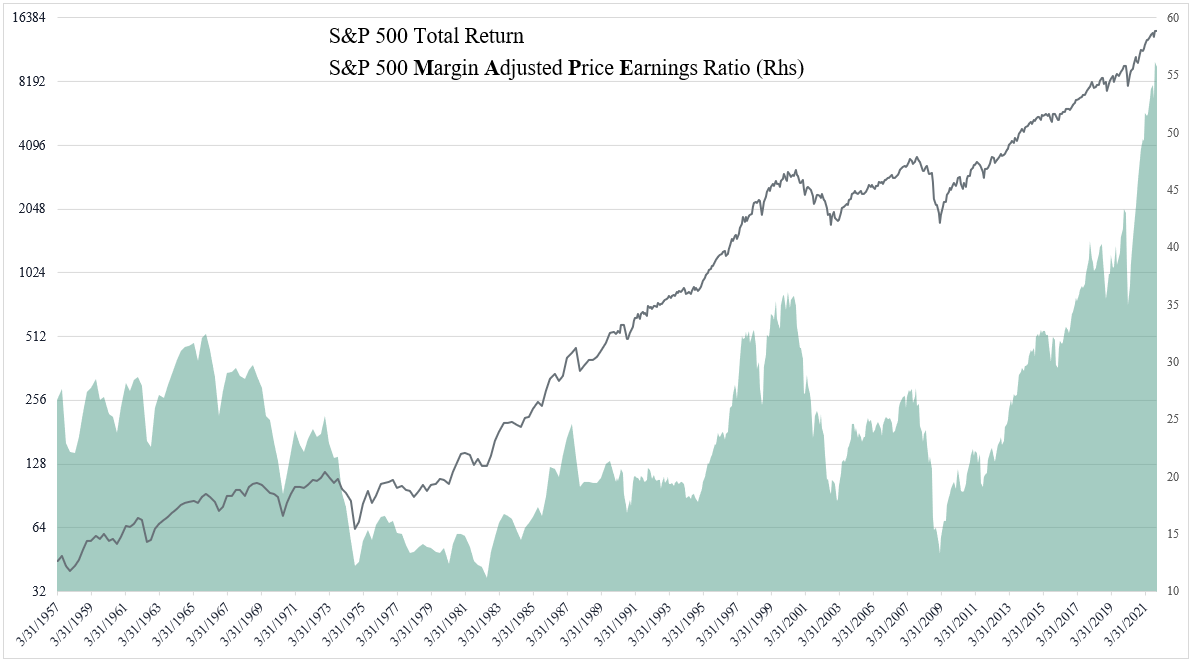
So explosive that the US S&P 500 is, at today's level, the most overvalued it has ever been. We will demonstrate it using a methodology proposed by J. Hussman, the Margin-Adjusted Cyclically-Adjusted Price Earning Ratio (MAPE).
R. Shiller and J. Campell proposed the concept Cyclically-Adjusted Price Earning (CAPE) to forecast 7-12 years markets future return using a long moving average of earnings back in 1988 (originally 10 years). The goal was to smooth out the business cycle influence on earnings in order to get a smoother series they called trend earnings.
The CAPE model was good at forecasting forward return in the past (M. Faber applied it to foreign markets too) but some argue that accounting changes, payout policies, a move toward less competitive markets could have made the CAPE model lose some or even most of its forecasting ability.
One can find some great discussion on the subject here and here.
R. Shiller introduced the Cyclically-Adjusted Total Return Price Earning Ratio to account for the change in company payout policies with the increased use of buybacks to return capital to shareholders.
Two flaws remained nevertheless.
First, as identified by J. Hussman, one can get an even smoother trend earning series by adjusting the CAPE to get constant historical margins. He uses 5.4% margin as its average. So if the most recent 10 years average margin is 7%, one ought to multiply the CAPE by 7%/5.4% (1.3). A CAPE of 30 becomes a MAPE of 40.
The second problem is that margin could have increased permanently due to structural change in the economy and the dominance of capital-light businesses.
While this might explain some of the increase in margin, we are convinced that a large part of the increase in margin is transitory and that once capitalism is allowed to work as it should, it will disappear. It will be the subject for another article.
Anyhow, we have assumed a permanent increase of margin to 7% starting in 1998 with the emergence of internet.
Let's now look at the data.
As one can see, today's MAPE is the highest it has ever been, dwarfing the 2000 Tech Bubble. Last year the situation was similar in the sense that the extreme overvaluation was concentrated in some sectors and large cap names while value(bis) and small cap stocks were undervalued (even deeply undervalued for value stocks on a relative basis), especially if the inflation scenario materializes).
While the relative value bet (and no value is not low PB) is highly likely to pay off on a multi-year basis on an absolute basis there will be few places to hide.
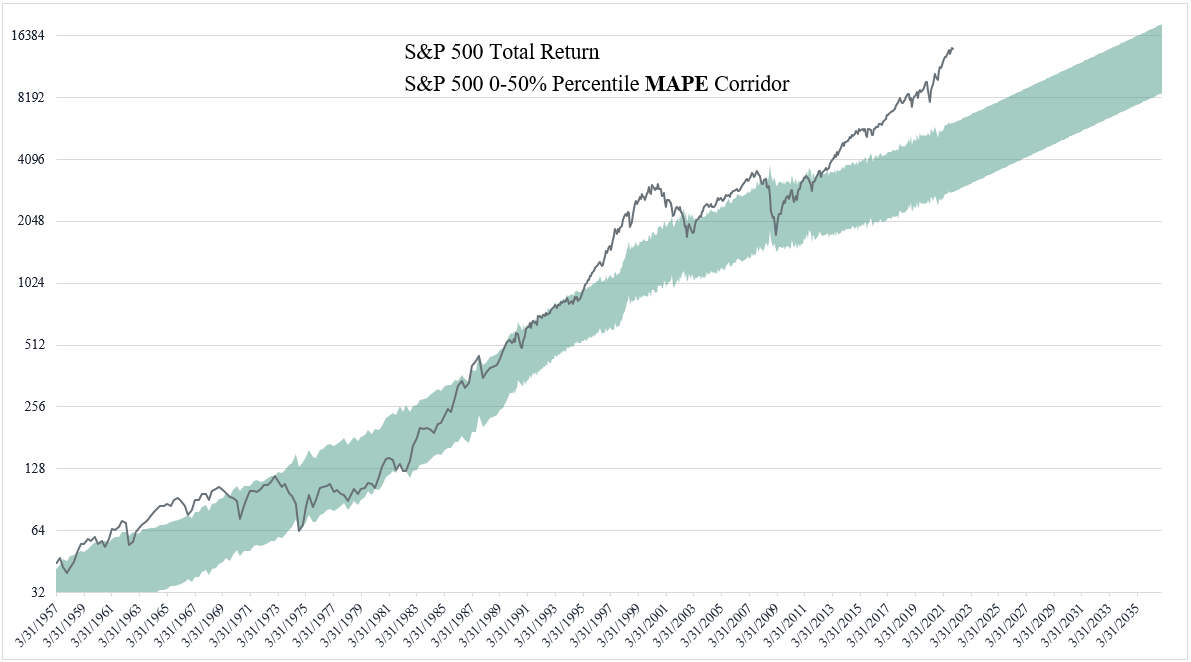
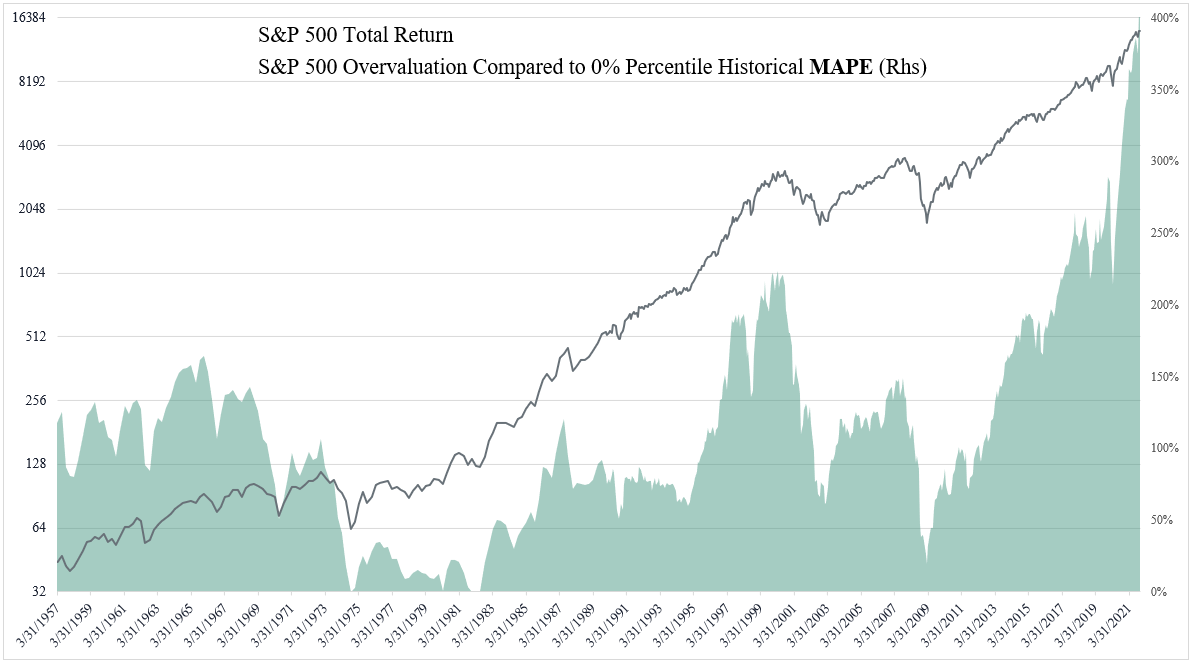
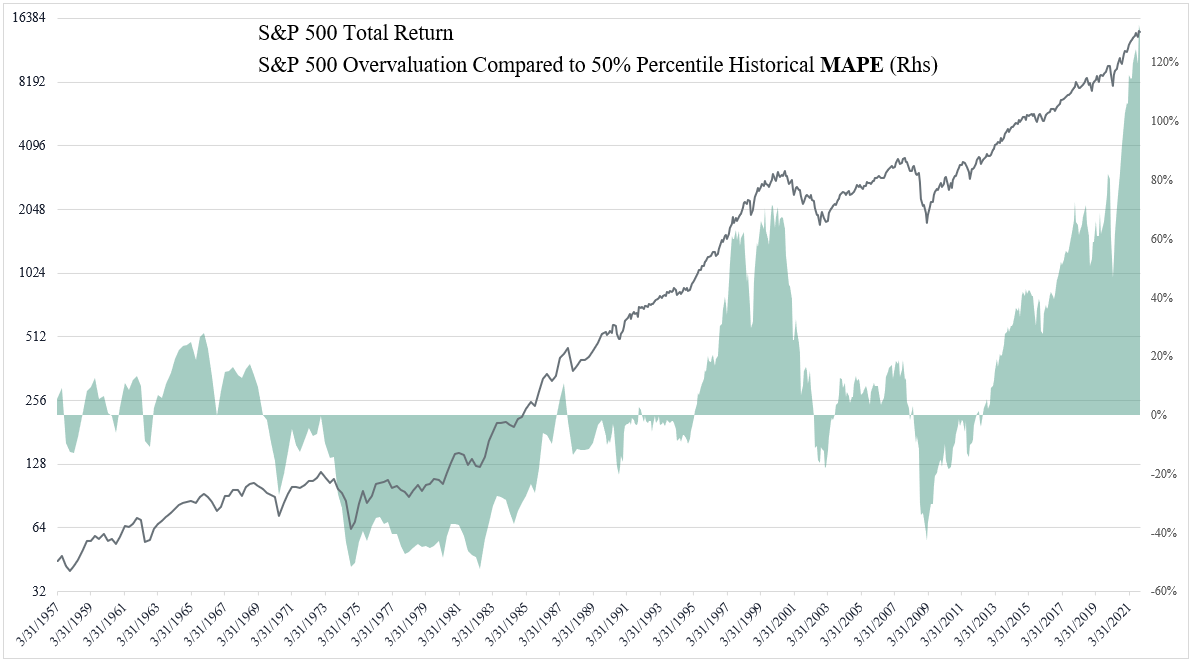
If we construct an historical corridor with boundaries between the 0% and 50% percentiles of MAPE history, the prospect looks grim for Buy and Holders.
The S&P 500 is currently almost 400% above the level corresponding to a bottom MAPE and 130% above the 50% percentile MAPE history.
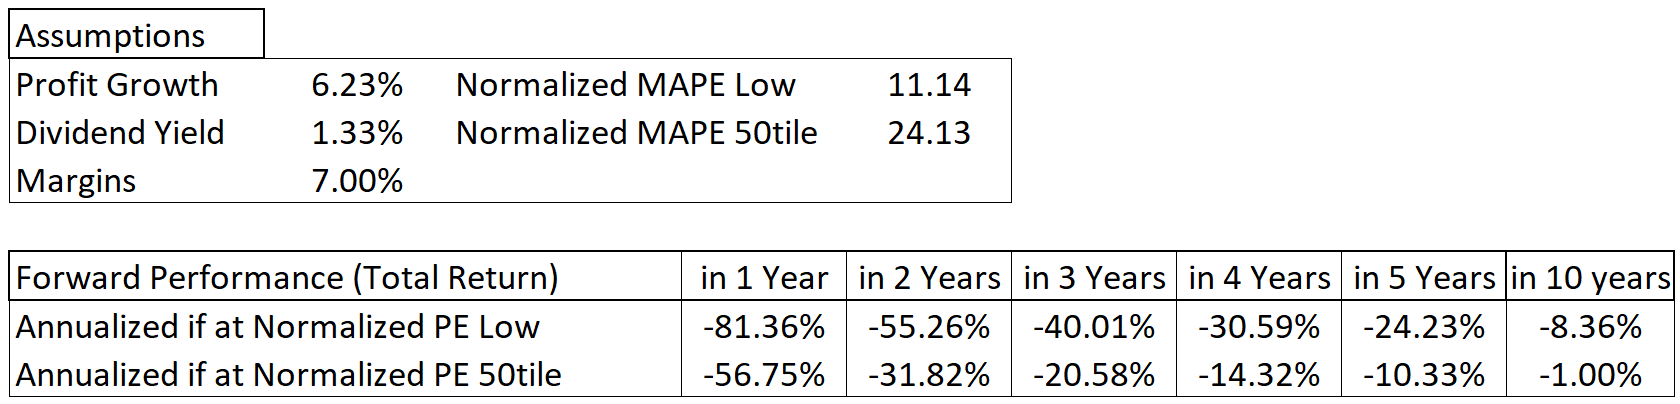
If we assumed a return to the MAPE 50% percentile, with nominal trend earnings growing at their historical pace and the current 1.35% dividend yield, one can see that the S&P 500 nominal total return for the next 10 years would be at -1% annually.
If the markets reached similar valuation to the summer 1982, the nominal total return for the next 10 years would be at -8.4% annually.
We doubt (and it is a strong understatement) the markets will wait 10 years to test the MAPE 50% percentile. A retest in the next 3 years is highly likely. Reaching the MAPE 50% percentile in 3 years’ time would imply an annualized 20.6% loss.
One should also not forget the historical tendency of deeply overvalued markets to fall significantly below the MAPE 50% percentile.
It is also important to remember that today's margins are above our 7% assumption and that the CBO is projecting around 4% nominal US GDP growth to 2031. The odds are thus stacked against the >6% nominal earning growth we have assumed.
Among all the factors which will impact the markets nominal total return, the most important is inflation. As we have said earlier, on a 10-20 years’ basis the politicians' rulers and their electors will favor much higher level of inflation.
We will discuss this in a later installment article but suffice to say that while nominal earning growth will be higher, ceteris paribus, with increasing inflation, the price investors will be willing to pay for each unit of earning will decline.
It is also important to keep in mind that while inflation should be higher than expected on a long-term basis, it does not mean that we could not have, especially after mid ‘22 a reappearance of deflation fear. At that point the Fed will probably again capitulate to the markets.
Nevertheless, being in the midst of the biggest bubble ever, the top might yet to be reached. If market timing is not your cup of tea, the following two quotes should be helpful.
"It is better to be out of the markets wishing to be in than in the markets wishing to be out" Unknown
“I never invest at the bottom, and I always sell too soon.” Nathan Rothschild
If one add risk-free rates and corporate fixed income yields at record low, passive investors are up for a painful decade and we completely empathize with the TINA mindset (did not originate where you thought) especially for those investors who must be invested by mandate.
Nota bene: It does not mean that the markets cannot continue to raise in the short-term.
About us:
NAVA Capital SA (‘Nava’) is a Swiss based advisory firm. It is a spin-off of a large Swiss single Family Office and it has developed since 2005 several proprietary quantitative strategies under active use, managing significant amounts of money.
Kroma Capital Partners Ltd. (‘Kroma’) is a Dubai based, DIFC incorporated - DFSA regulated entity holding a Category 3C license. This license allows Kroma to Managing Assets, Holding and Controlling Client Assets, Arranging Credit & Advising on Credit, Advising on Financial Products and Arranging Deals in Investments. As a distributor we have advised clients on funds and bespoken solution since 2017 with assets raised > 1.3 bn $. As an adviser we advise 3 investment vehicles: a fund of private markets funds, a volatility fund of funds and a US long/short equity fund.
Nava and Kroma have entered into an exclusive partnership offering quantitative investment solutions under the Sentinel Family of Strategies. We offer institutional investors solutions with our Sentinel Gurus US Long/Short strategy, our Sentinel Enhanced Long/Short indices strategies (which can be run on any sufficiently large stocks universe), our asset rotation strategies and our volatility strategy. All strategies are highly liquid and offer full transparency and Mark-to-Market pricing.
Bespoke investment solutions are available as:
· AMC’s on the UBS Platform
· European Funds under the OpenFunds SICAV AIF / UCITS
· Cayman Funds (exp. 2022)
If you are a qualified or an accredited investor and want more information on the above, you can contact us at:
contact@nava.capital
If you have any comments on this article, you can contact us at:
blog@nava.capital