September 11, 2023
Summary
- Divergences
- Regimes
- No Landings? In your dreams!
- Households – Interest rates sensitivity, employment and delinquency
- Corporations – Interest rates sensitivity, credit and more
- Concentration, again
- S&P 500 fair value
- Volatility… beware
Macro – Divergences
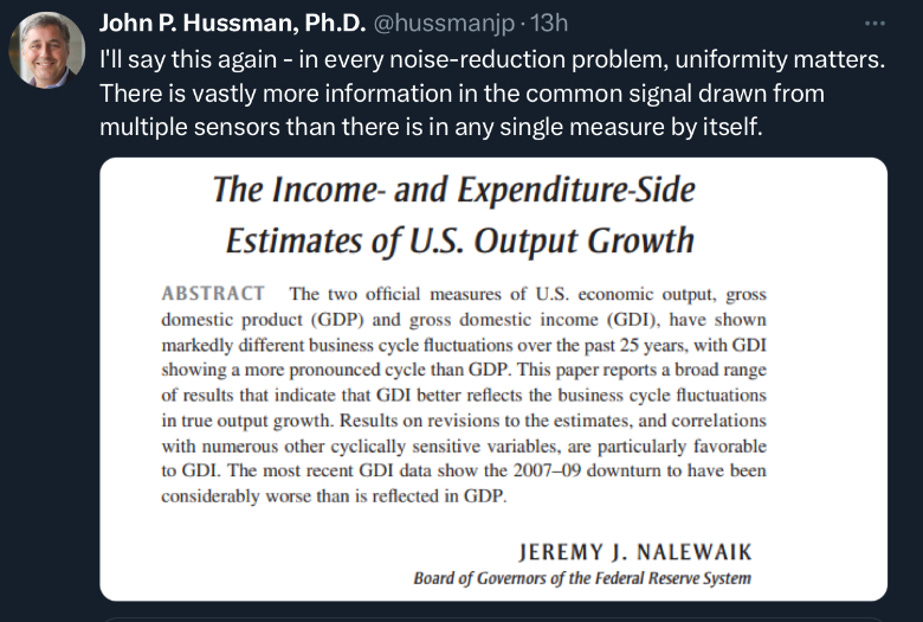
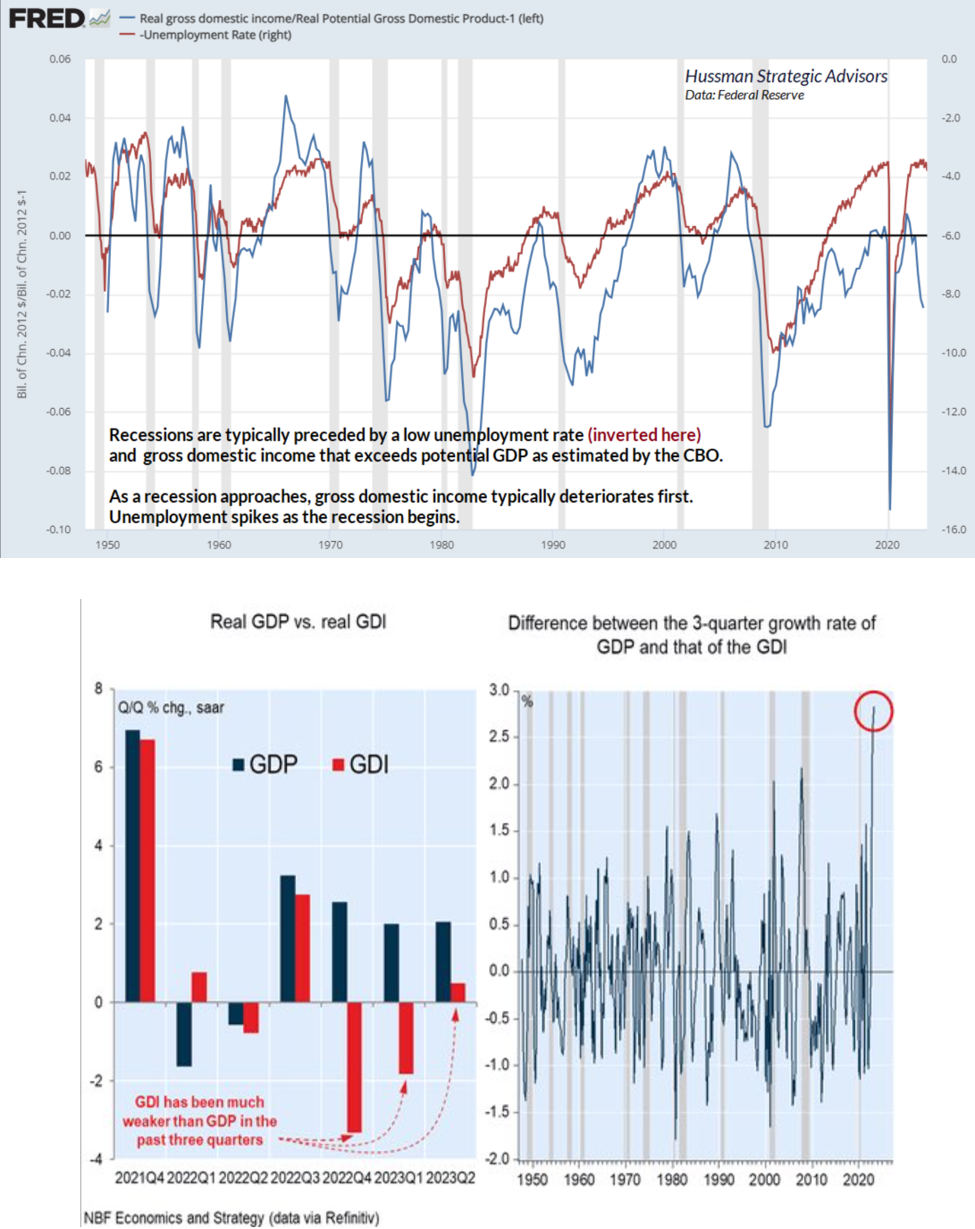
Some analysts have noticed the increasing divergence between GDP (gross domestic products) and GDI (gross domestic incomes) with the latter badly lagging recently.
John Hussman, another big proponent of the study in uniformity, GDI is a better predicator of the business cycle.
Macro – Regimes
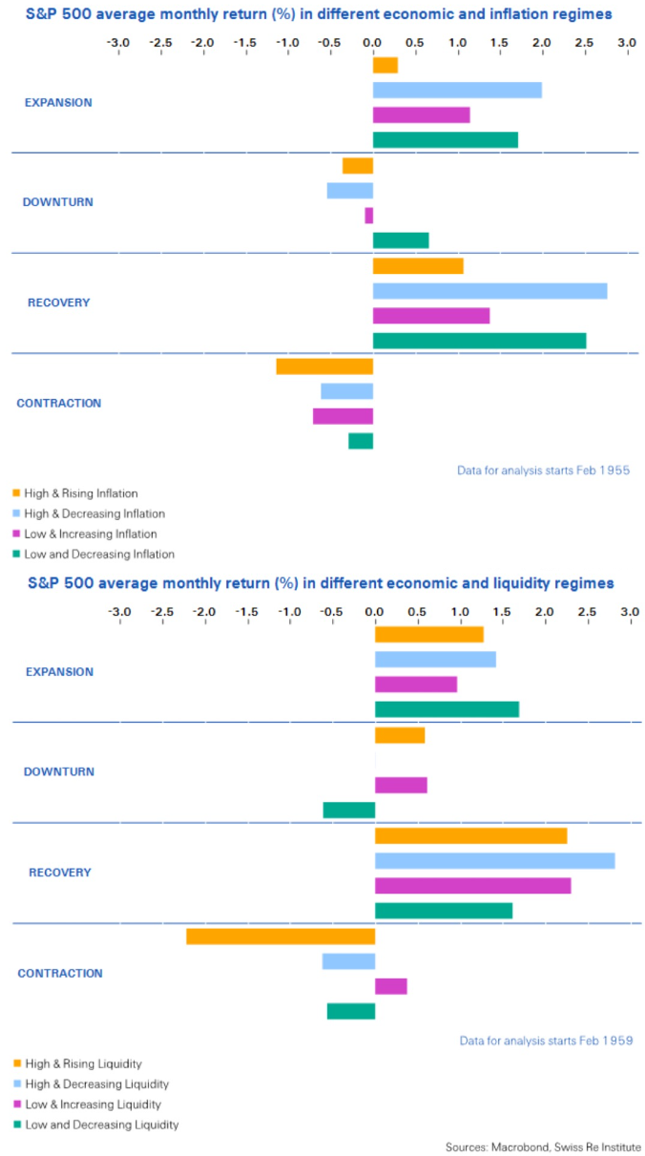
Before we move to the rest of the macro section, we want to present 2 graphs from the insightful P. Saner (who is almost weekly in our Mashups!).
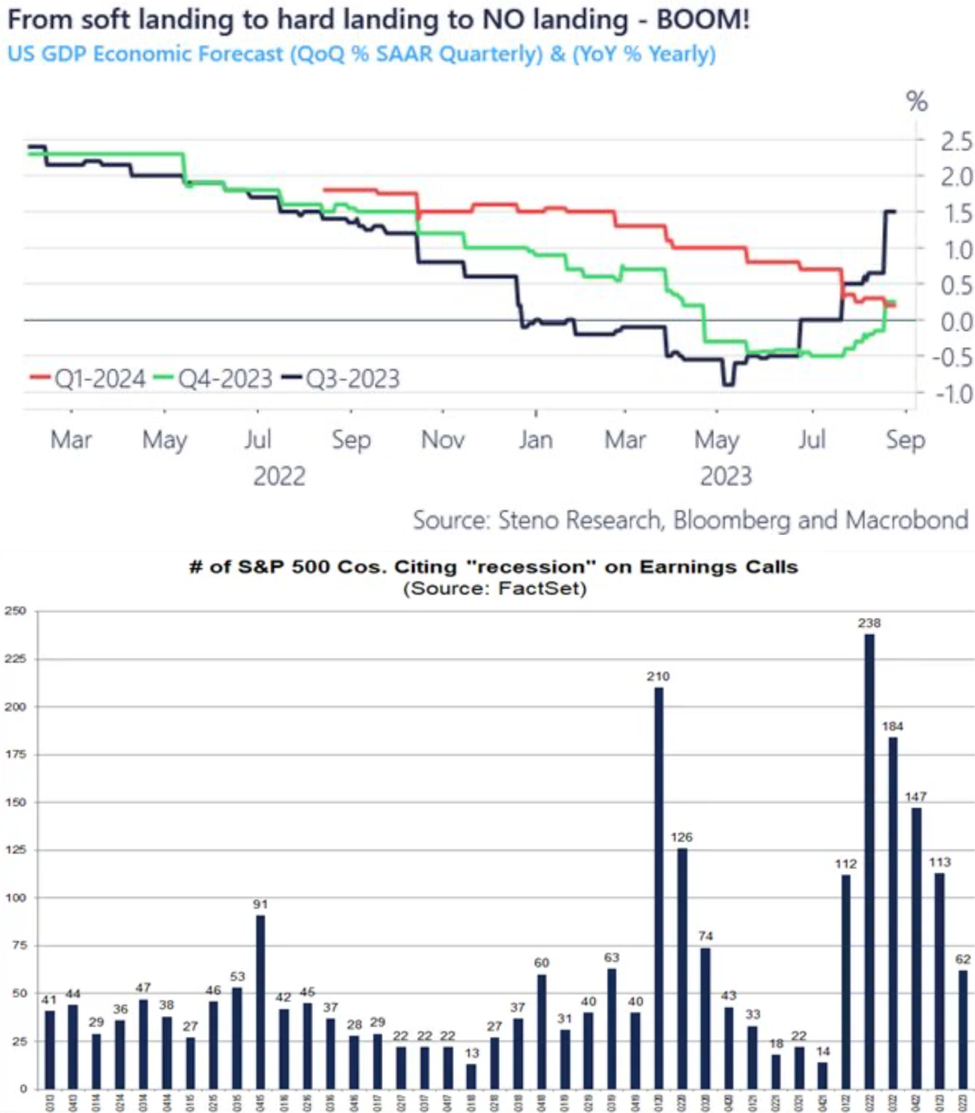
Macro – No Landing?
As described in previous MashUps, the narrative has moved from hard landing to soft landing and now no landing. One can also see it in recent US GDP forecasts recent change and in the number of S&P 500 companies citing recession on earnings calls.
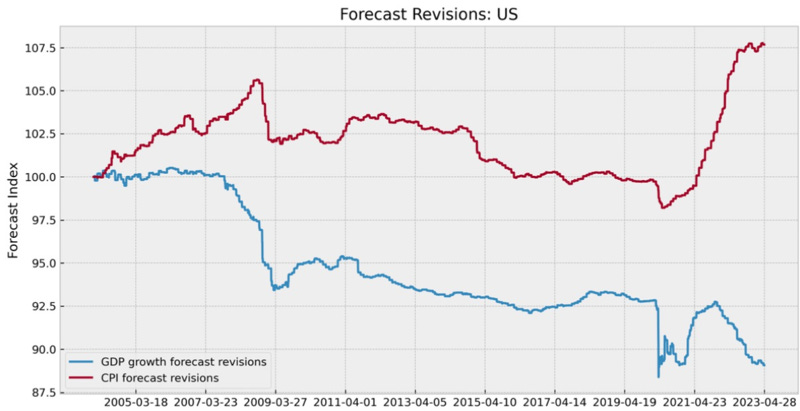
If one look at this excellent analysis of @countdraghula, one can see that economists track record at forecasting 1 year forward GDP and inflation is pretty dismal. A falling line indicates that their expectation were too optimistic.
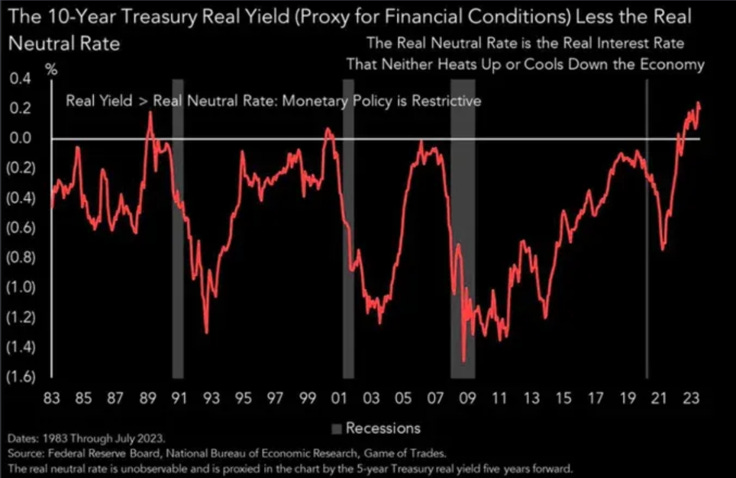
10 years real yields seems to be restrictive now. They are going to get even more so if rates stay where they are and inflation continues to fall. As said in previous mashups, while the initial consequence of rising yield had more than an expansionary macro effect, the more time pass the more it becomes a headwind, first hitting low cash high revolving loans households and companies and slowly moving up the ladder. Quantitative tightening should have been much more aggressive to slow the economy in the initial phase of rate increases.
Macro – Rates Impact
How did the S&P perform after the Fed last rate hike? Jaroslaw Jamka analyzed the path depending on the inflation cycle.
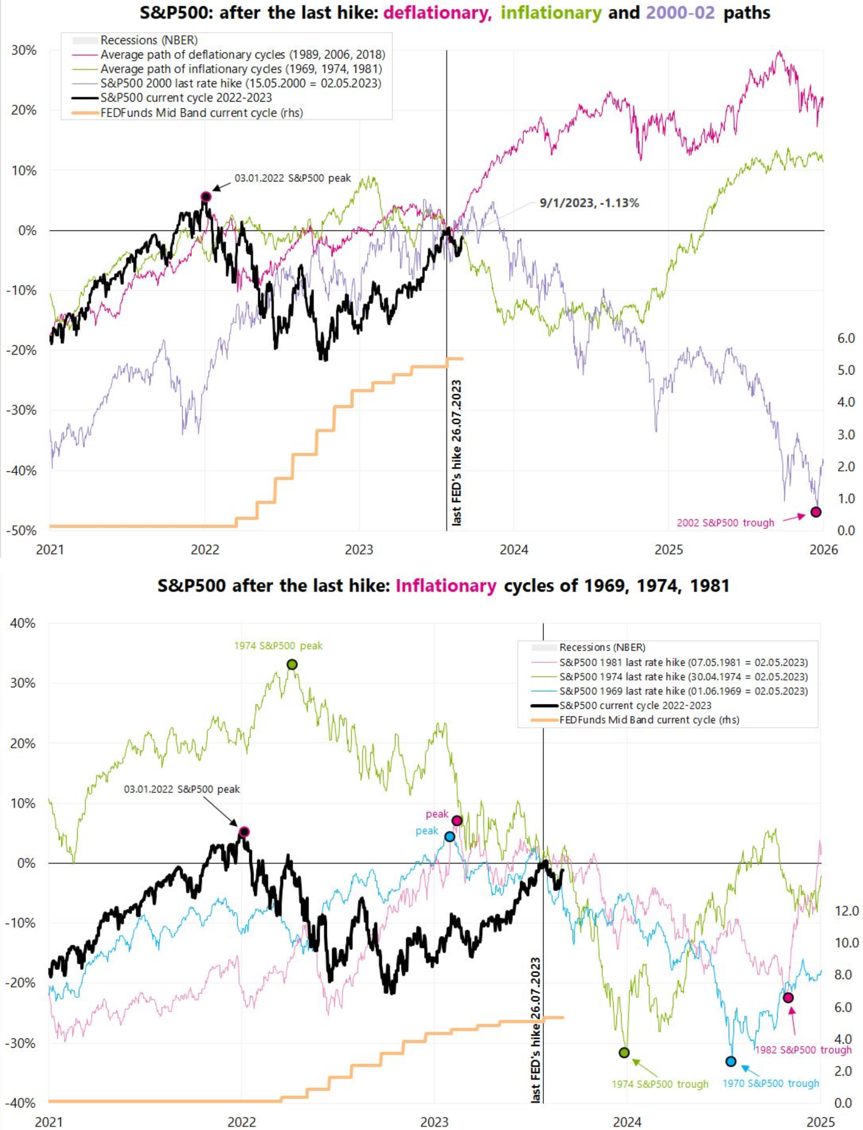
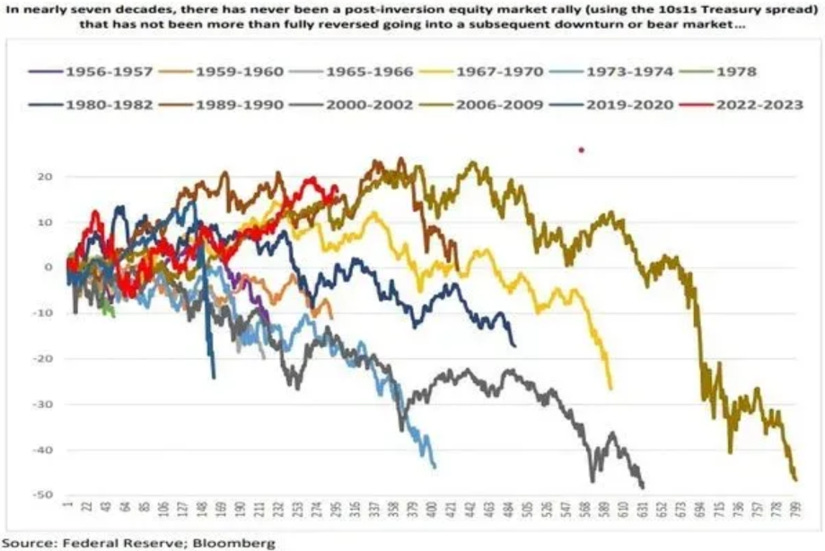
Marketwatch analysis is not bullish. NEVER in the past 7 decades, a post inversion equity market rally (10/1) has not been fully reversed in the ensuing bear market
Macro – Government Spendings
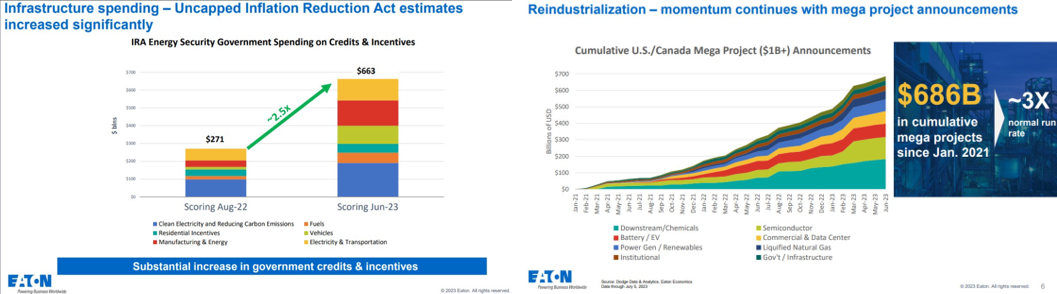
Eaton Vance recently produced interesting slides on the Uncapped Inflation Reduction Act spending. While we have shown previously that the budget deficit has increased mostly because of falling revenues and not increasing spending, the IRA has been a big contributor with large mutliplier effects (and very unsure final return on investment but the government money part usually does not really care as long as they win the next election. Après-moi, le déluge).
Macro – Households - Prices
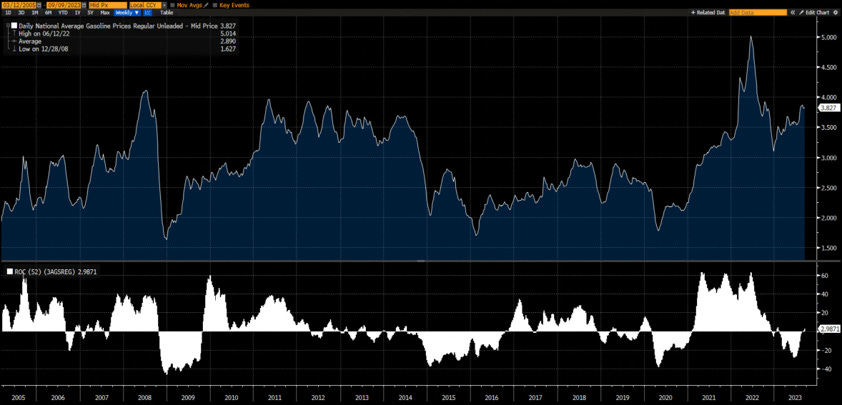
We have described ad nauseam the impact of raising rates on households and companies (the lower incomes/assets/balance sheet quality/volatility of earnings, the quicker the impact of raising rates). Low income households were helped by falling gasoline prices. They are rising again on a YoY basis and not far from the levels which impacted consumptions seriously in the past.
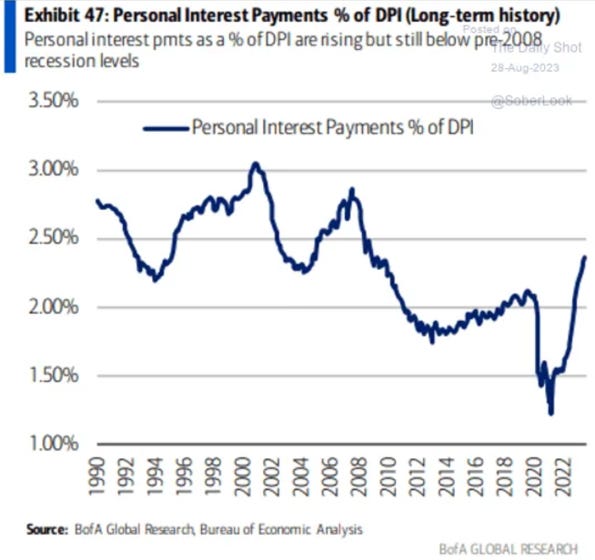
Macro – Households - Interest Payments
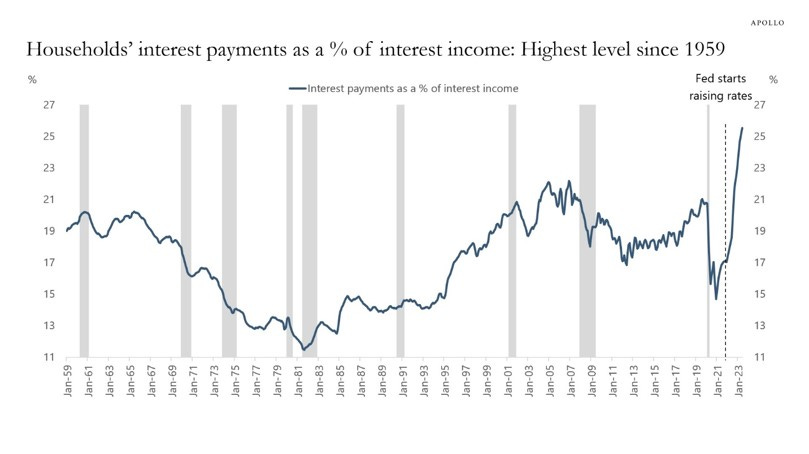
The impact of rising rates can be shown using different time series. The one below show the percentage of interest payments as a % of interest income and it is rising quickly to new historic highs. Most importantly, the richest households have low rates and long duration liabilities so the graphs is not even close to show how hard times are for poor households…
The same is true for personal interest payments as a % of disposable personal incomes (which include interest incomes).
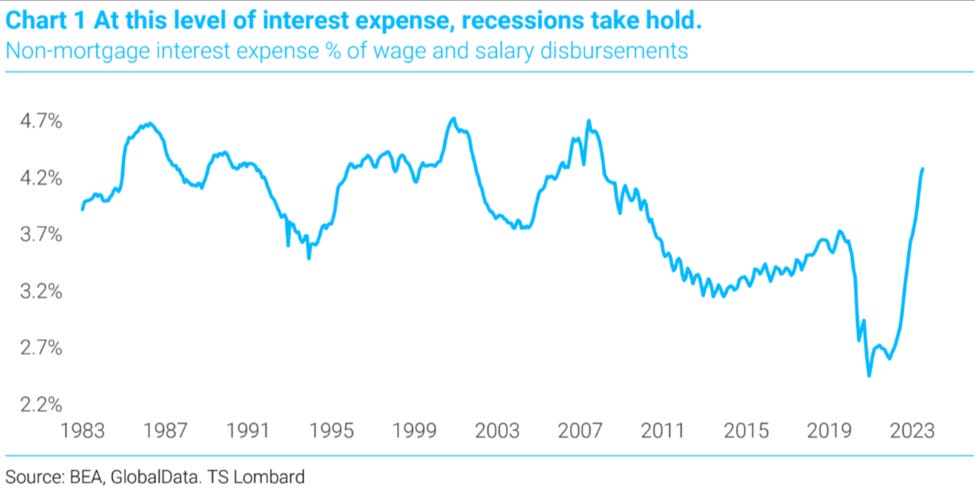
Non-mortgage interest expense as a percentage of wage and salary disbursements gives a better picture
Macro – Households - Employment
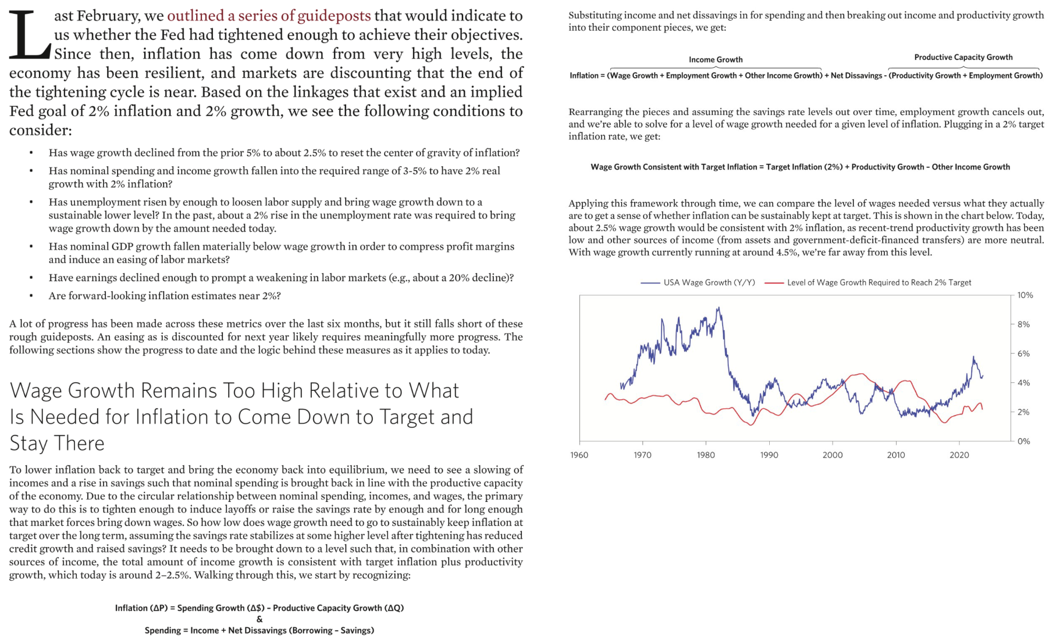
According to Bridgewater, US wages are still growing much too quickly to reach the 2% inflation target.
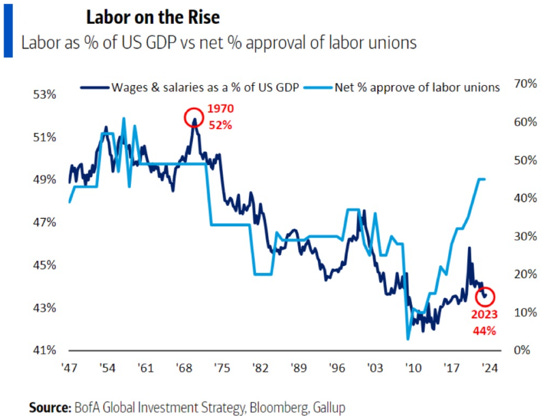
Labor unions approval are going through the roof. The media coverage of the UPS drivers new contract deal and the ongoing discussion of the UAW with the major auto constructors, will push more and more workers to ask for higher salaries and benefits. This will make the work of the Fed harder and also eat into companies margins.
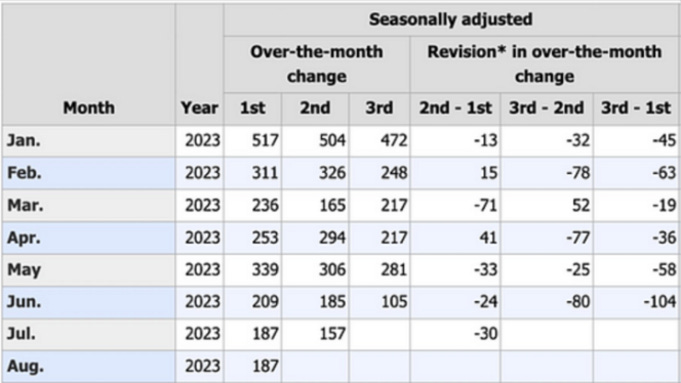
Downside revision to the Payroll numbers have continued to be negative (7th month in a row). This is something we have warned about in previous Mashups.
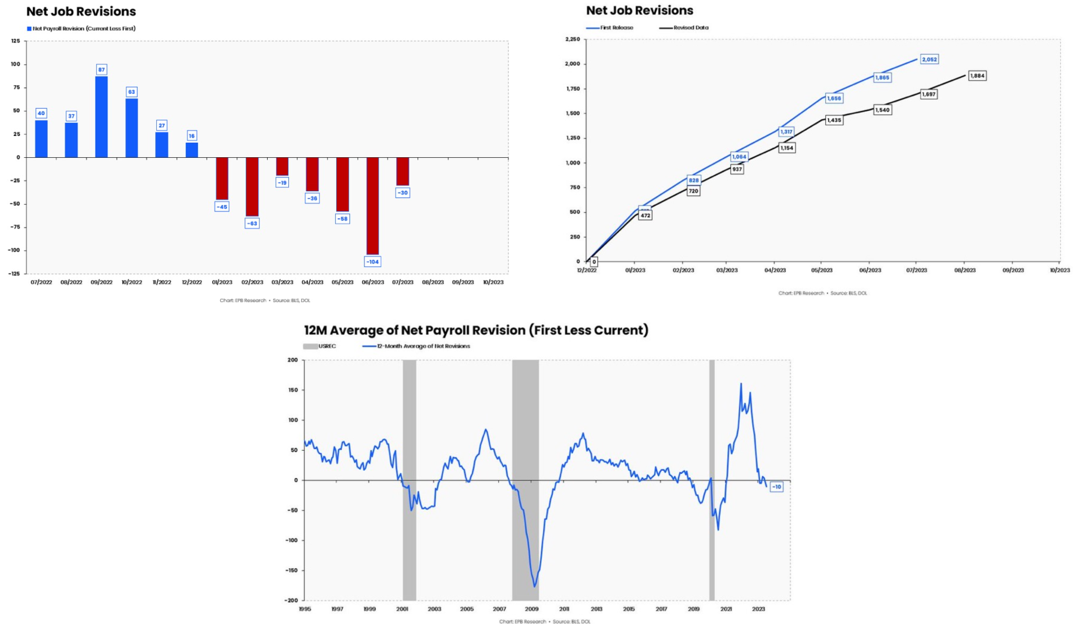
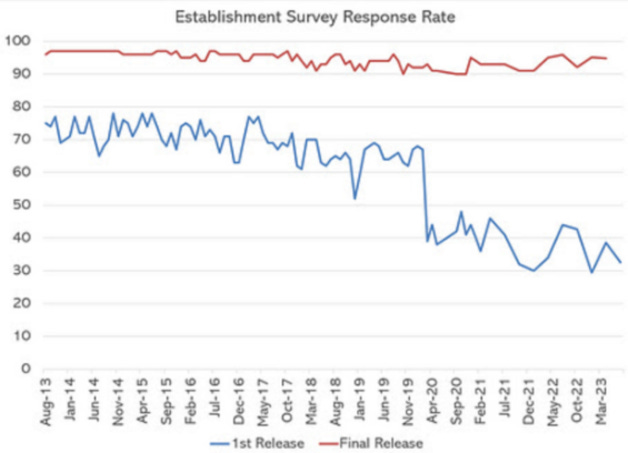
One can even see, courtesy of the excellent Michael Green, that the 2nd and 3rd revisions have been negative most of the time. He had a great chart on why the first number published, beside the Birth Death adjustment, could not be trusted i.e. response rate.
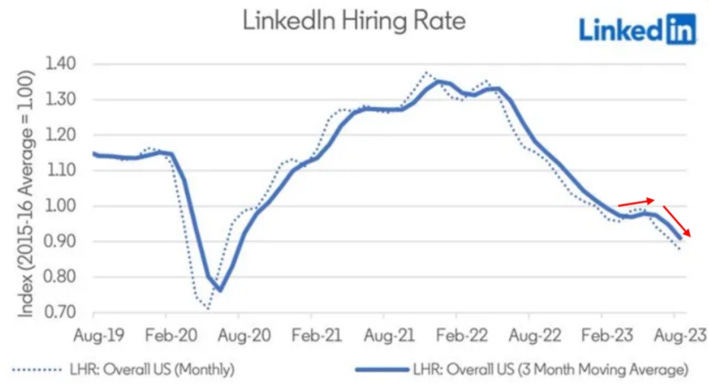
LinkedIn hiring rate is declining again...
… and David Rosenberg had a good summary of the latest JOLTS report.
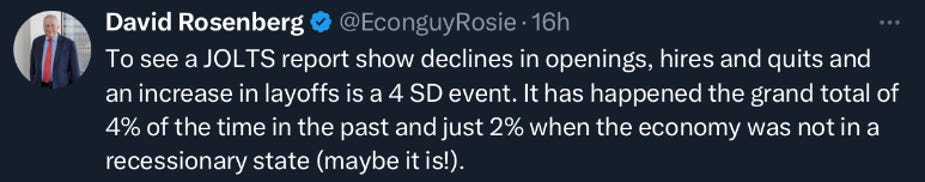
We can add that it was the biggest 3 month decline in job openings on record excluding the Covid shutdown
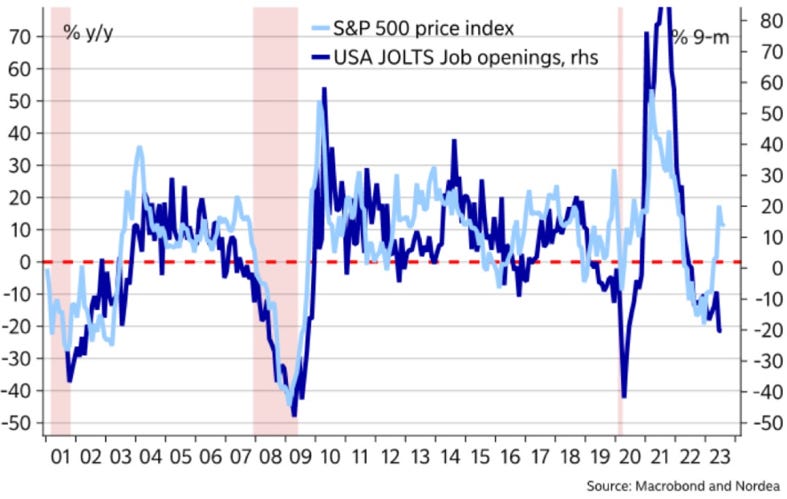
Some graphs on the report…
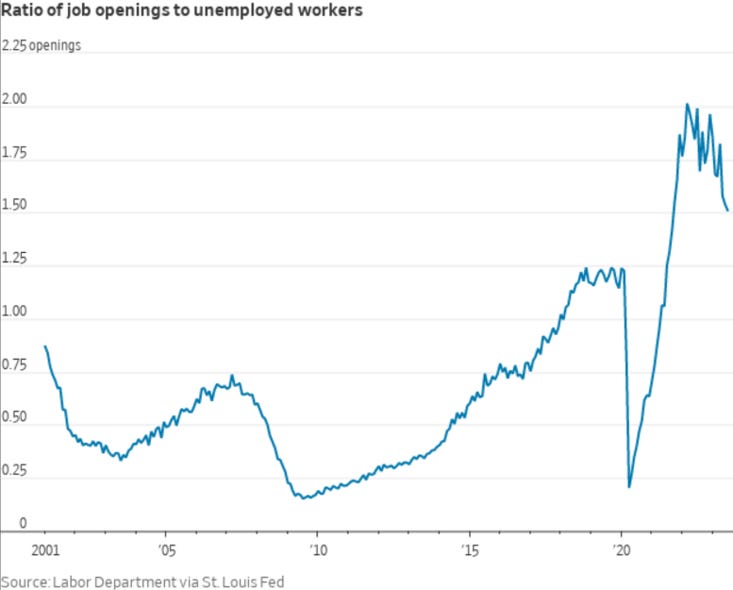
The job openings to unemployed workers ratio remain historically high though…
Macro – Households - Consumption
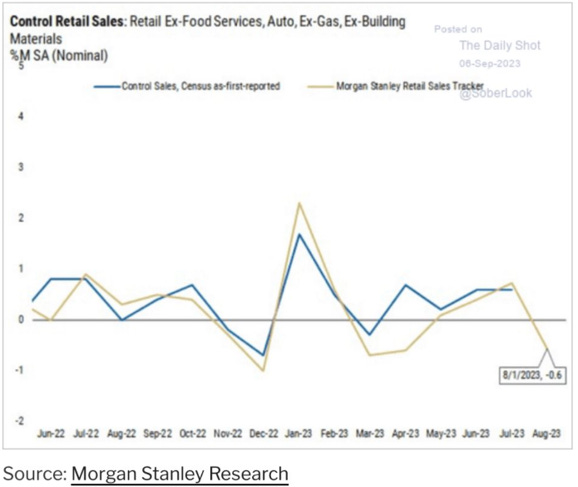
Lower income households struggle can be seen in the retail sales number and…
Macro – Households - Delinquencies
… while mortgage delinquency remain low…
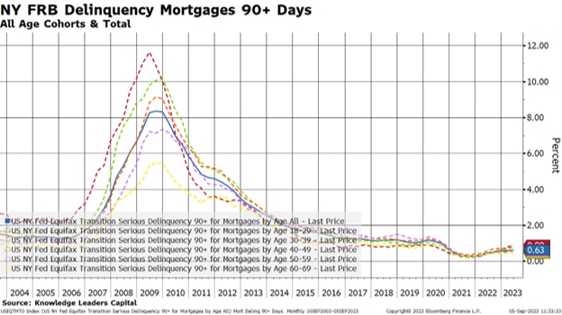
Auto and Credit Card delinquency are on the rise (sign of the dichotomy of the new class struggle).
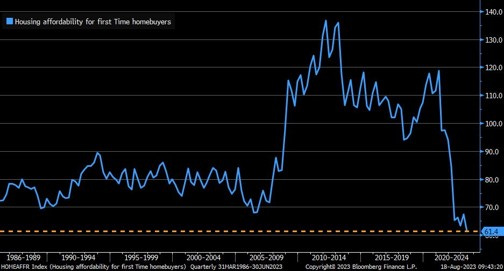
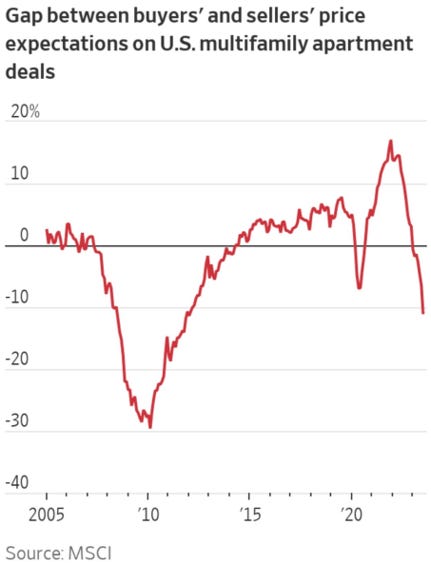
Macro – Households - Housing
Two graphs on housing.
The first on first time homebuyers affordability…
And the second one on the gap between buyers’ and sellers’ price expectation for US multifamily apartments deals. The gap is big which explains the lack of current activity. Sellers are waiting as long as they can. “Higher for longer” is going to hurt them a lot.
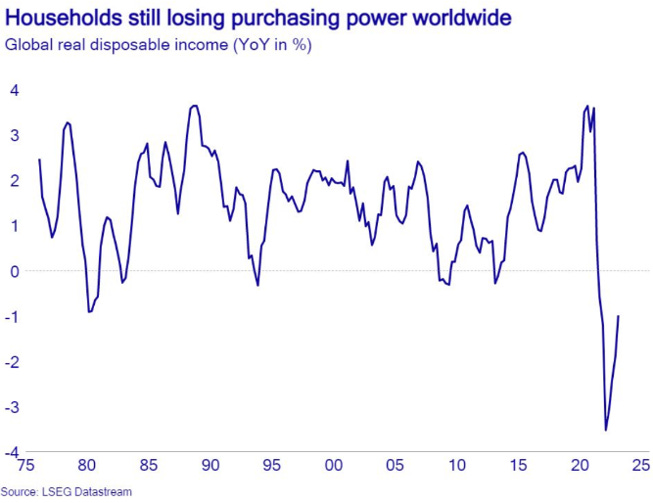
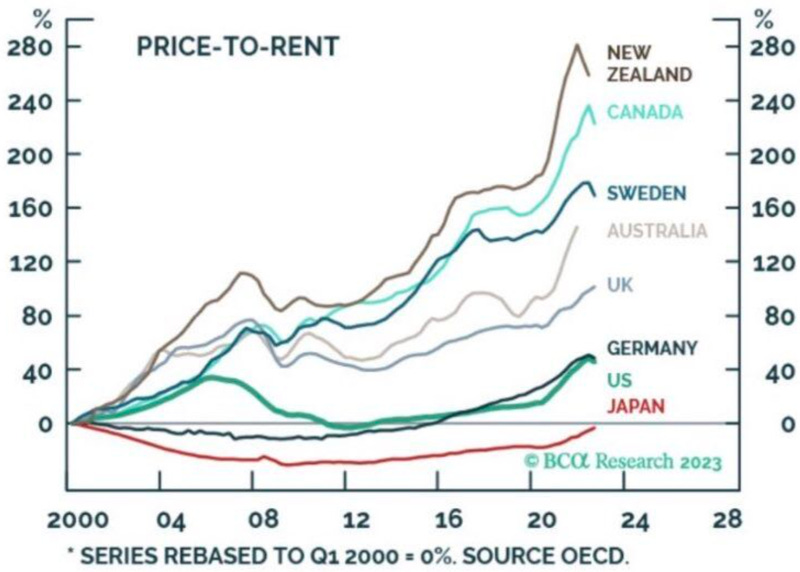
Macro – Households – Global
Given lower, sometimes much lower mortgage maturities outside of the US. falling real disposable income combined with nosebleed housing prices and a more sensitive corporate sectors (more dependent on bank loans as shown later) is a perfect combination……..
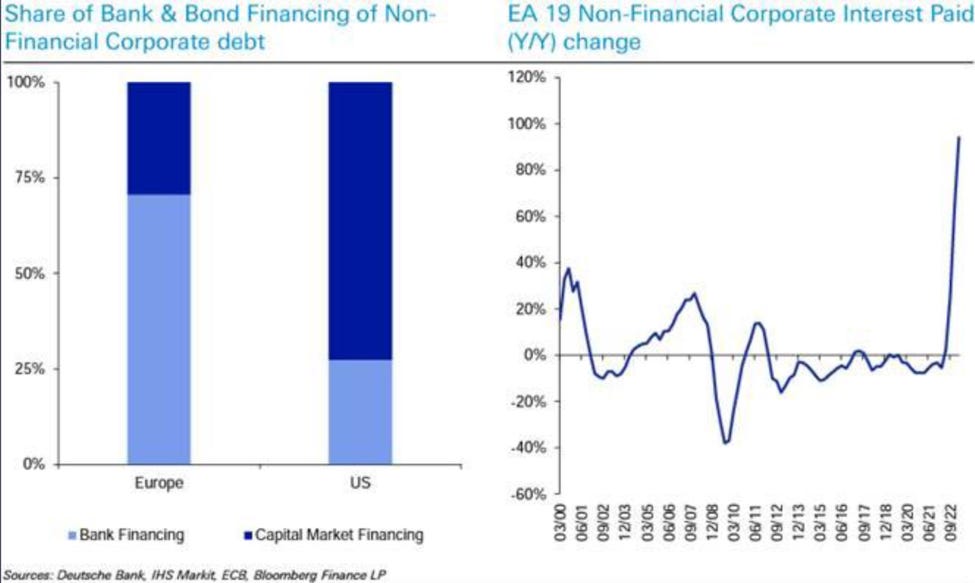
Macro – Corporations – Interest Rates
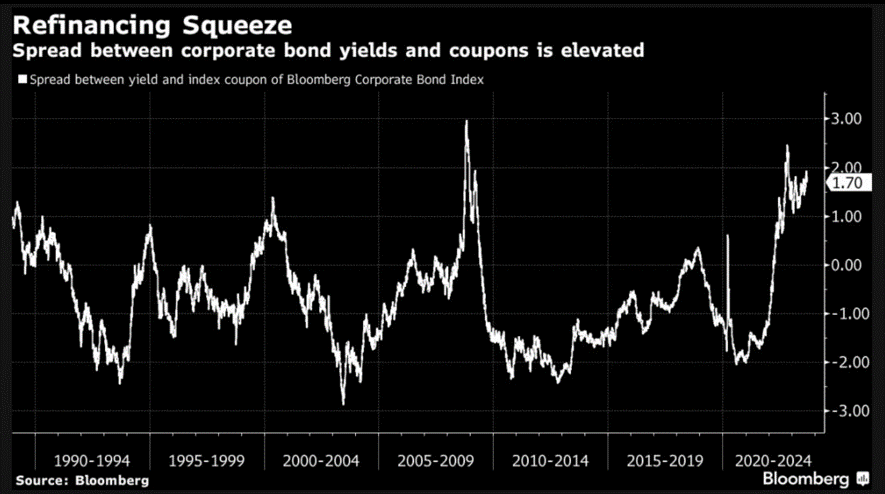
As with households, the refinancing squeeze will be first felt (and should start to be felt now) by lower quality balance sheets. In the graph below one can see that the spread between current bond yield and coupon is elevated. Given the low current corporate bond activity, this gap is probably an understatement.
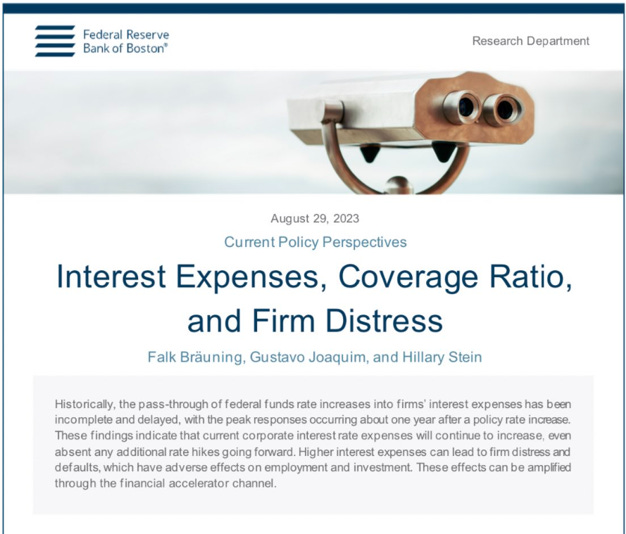
The Federal Reserve Bank of Boston recently published a paper on the delayed impact on corporation cash flow.
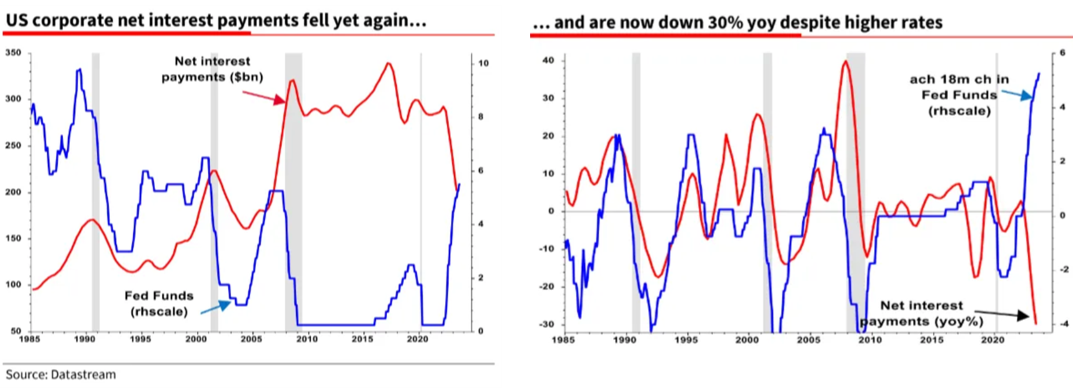
The lag can be clearly seen in the SG graphs here below.
One can also see how European companies, more reliant on bank financing are hit more quickly by rising rates.
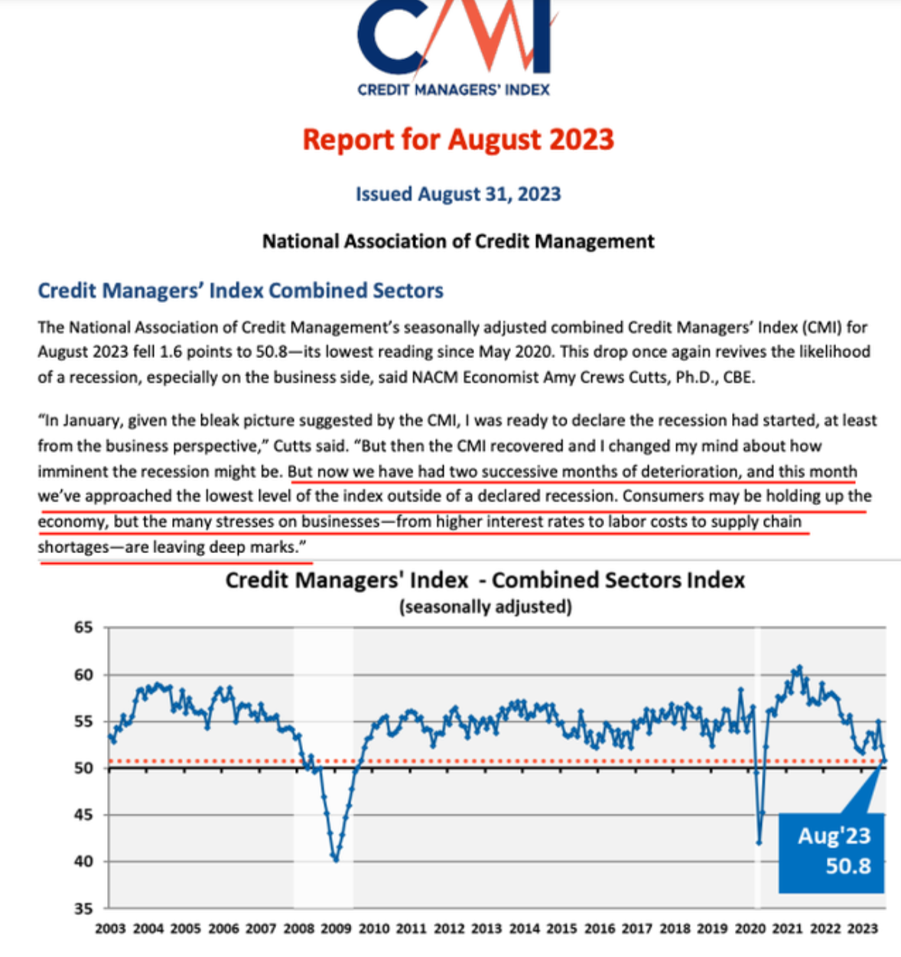
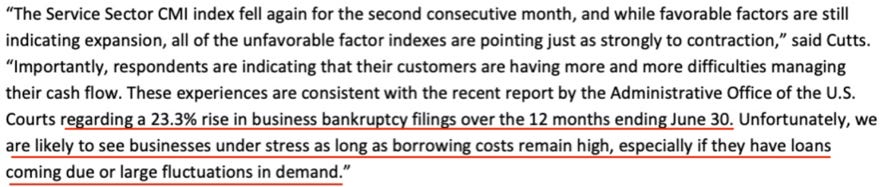
The latest National Association of Credit Management report make for a bleak reading...
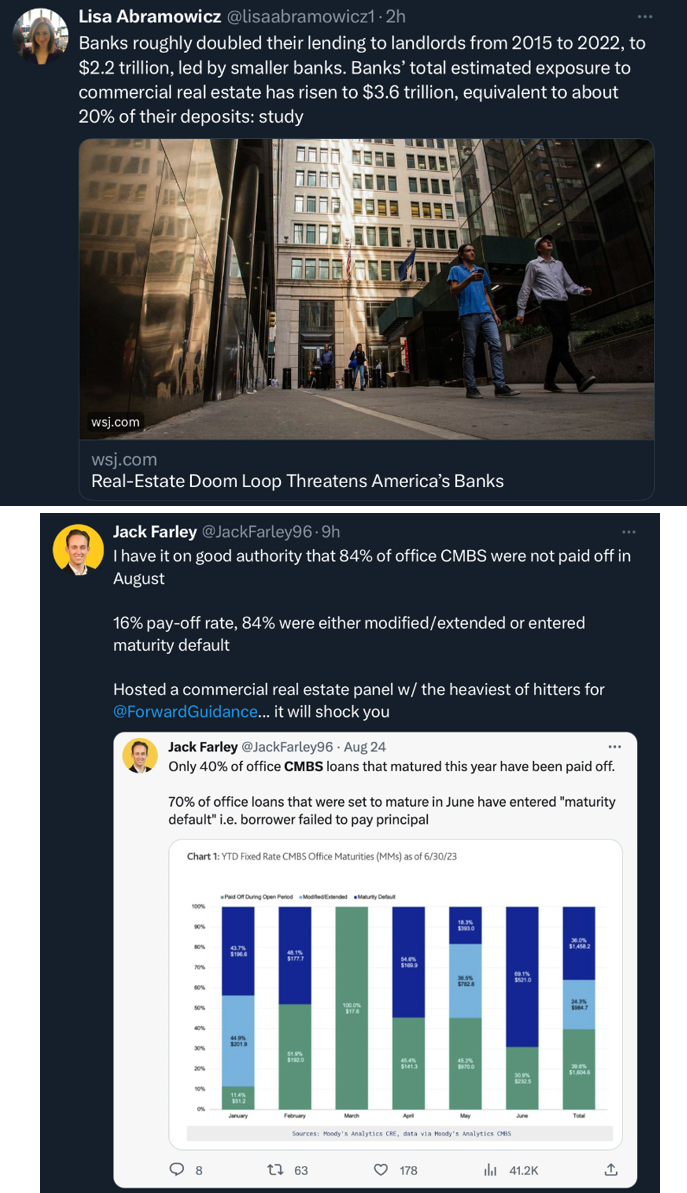
Macro – Banks - CRE
Oops… Combining this with rising long-term rates, we are sure bank balance sheets looks great…..?
Market – Liquidity
The market section will be brief this week.
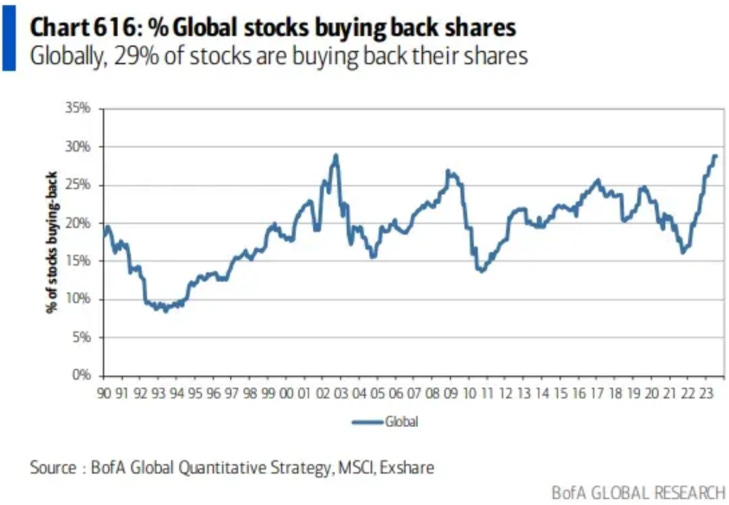
Lots of companies are buying back shares globally. In future mashups we will show why we believe this is going to be a positive factor for some part of the world.
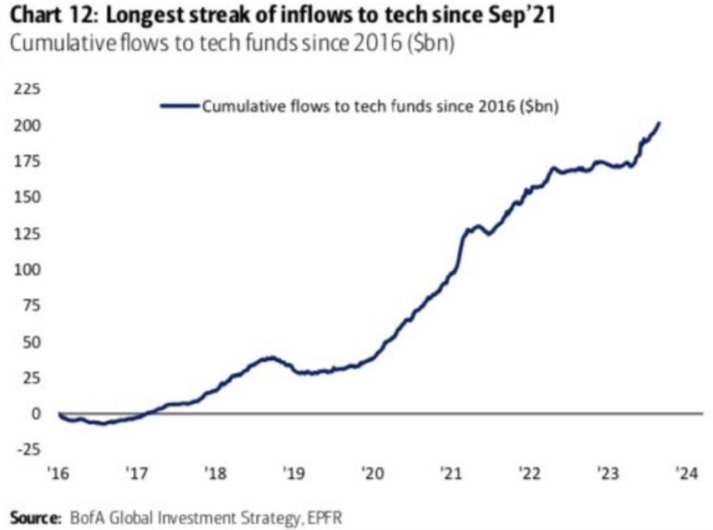
Inflows into the tech sectors have reaccelerated recently. It could be a swan song.
Market – Sentiment
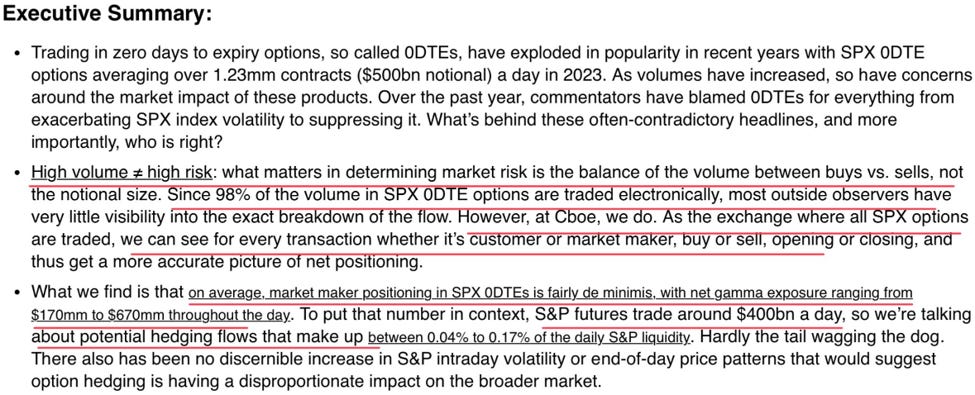
We alluded to the debate on the real influence of the boom of 0dte option on market structure in the past. The CBOE published a paper on the subject.
Market – Breadth
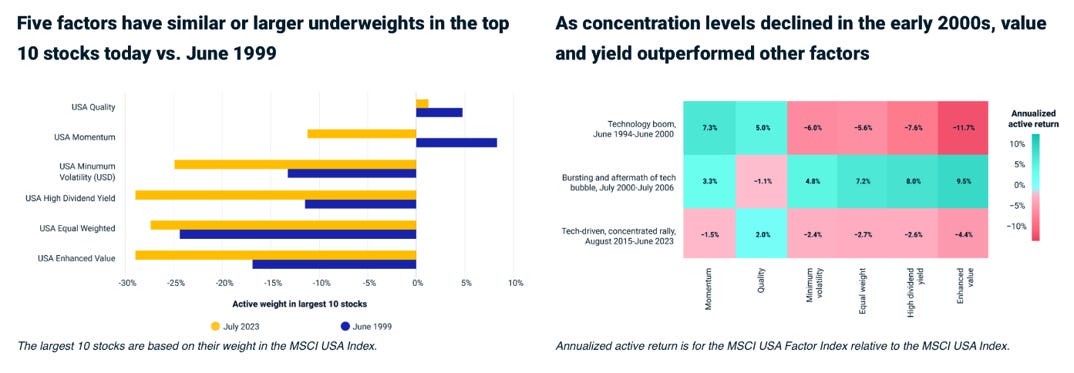
Markets are still dominated by mega cap tech names. Bigger seems to be better for now but it won’t last…
AQR published a good paper on the problematic of market concentration, good companies and good investments.
Lack of concentration into the top 10 stocks can also be used for factor allocation.
Market – Valuation
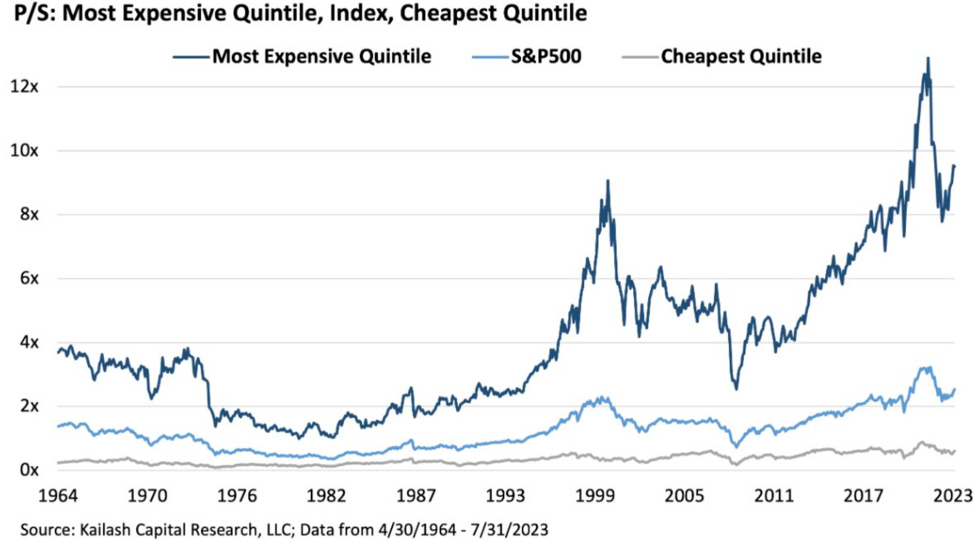
The spread between the most expensive and the least expensive stocks is historically wide. It is not due to the absolute cheapness of the least expensive stocks but to the extreme overvaluation of the most expensive stocks.
Vanguard Value vs growth model is at an extreme again. It implied a strong outperformance of value vs growth in the next few years.
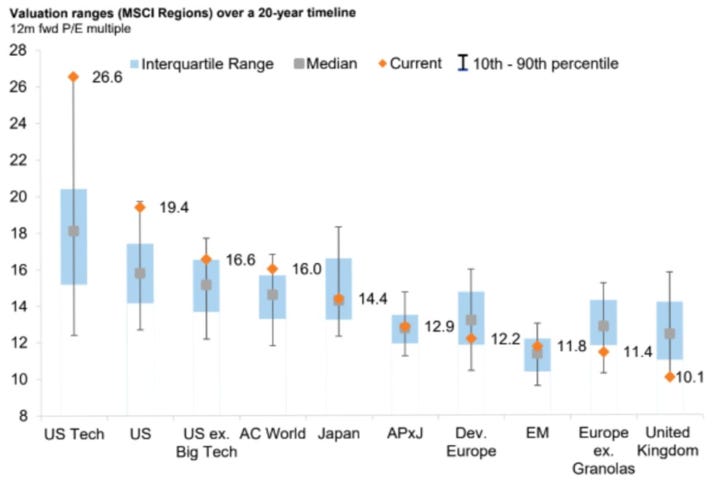
GS seems to reach the same conclusion. With regard to global markets, the US seems to be the outlier in term of extreme overvaluation.
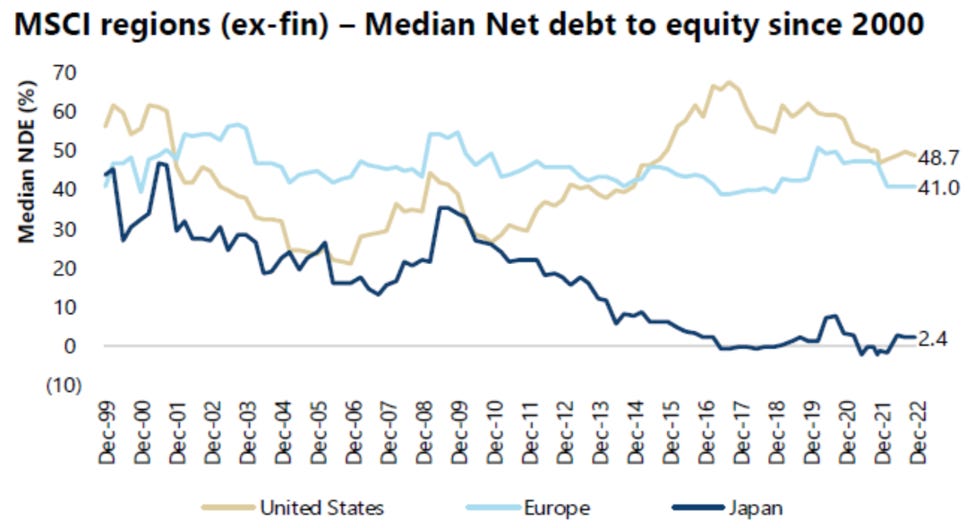
Japan on which we have written a lot in the past has a low median net debt to equity.
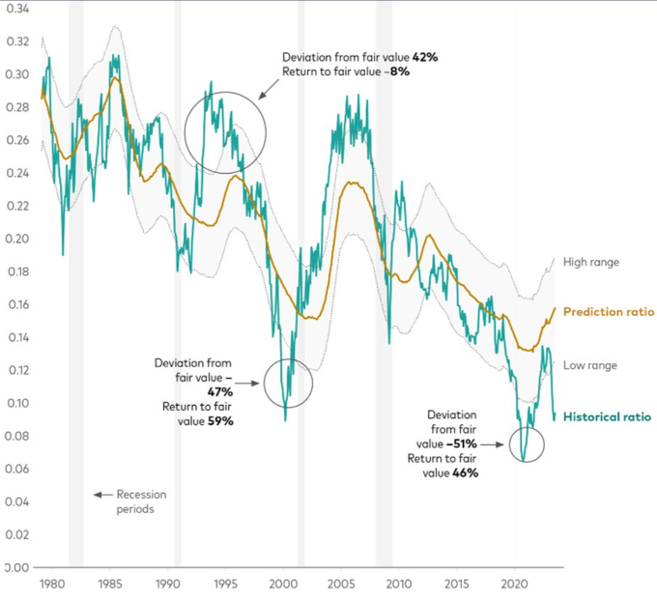
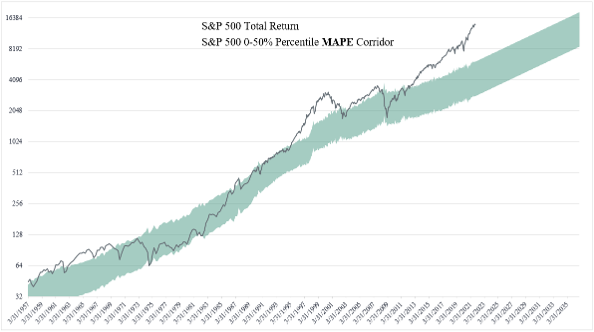
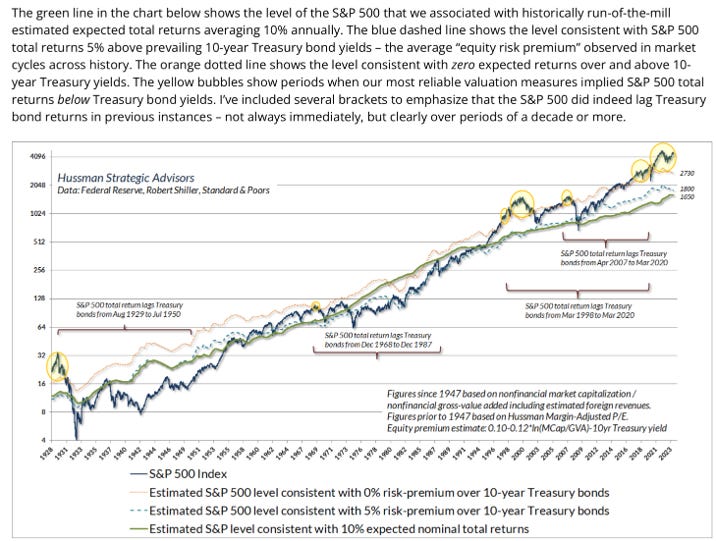
We receive a lot of question on what we think the S&P fair value is. We have written an article on the subject in December 2021 https://research.nava.capital/market-valuations/ You can see our MAPE corridor in which we strongly believe the S&P 500 will wander at least once in the next few years (probably sooner than latter).
While our methodology differ somewhat, J. Hussman works reach a very similar conclusion.
Market – Volatility
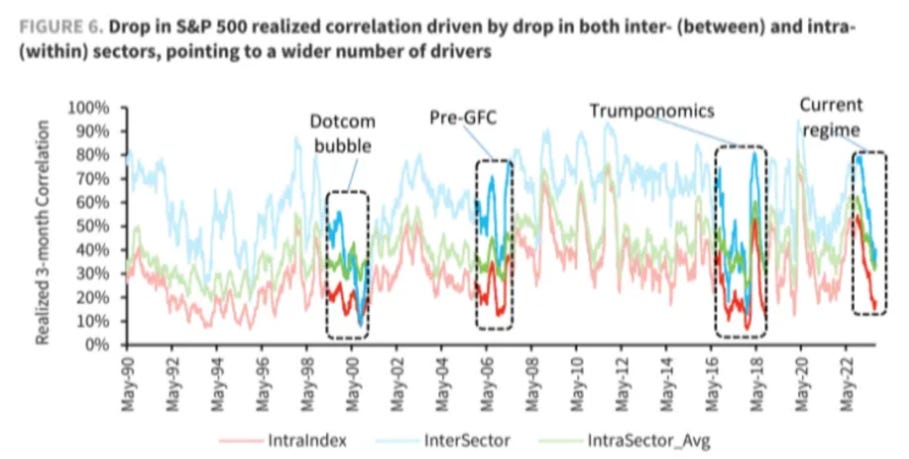
Realized correlation has fallen precipitously in recent months. It has more often than not been the precursor of a big increase in implied volatility.
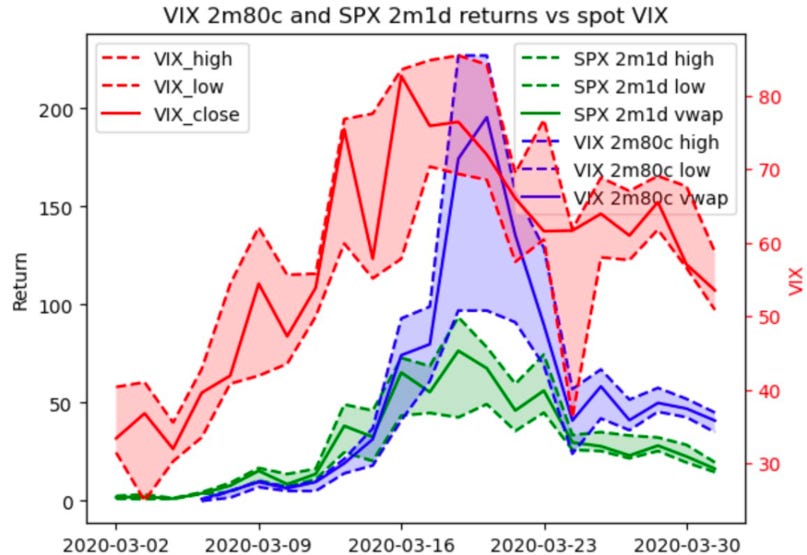
Remember than when/if, the VIX start a rapid move to the upside, it does not need to reach the strike price to rise exponentially… Selling high strike calls might seem like printing free money but it can rapidly turn into a nightmare. We feel that one should refrain from it in the current environment.
Others
Indeed…