Magic Formula globally, just a start...
I was a pure fundamental stock picker during the first 8 years of my career. During those years I also worked as a strategist for one of the largest bank in the world. I believed that at the macro level markets were sufficiently inefficient that systematic quantitative models could give an edge but that it was not the case at a micro level (yes value had beaten growth, small large,... but after transaction costs and slippage I believed that not much would be left).
Today, I still think that asset allocation is best done with a quantitative straitjacket and that quantitative stock picking as it is usually done, is not worth the effort but...
In 2006 I read Joel Greenblatt's "The Little Book to Beat the Markets" and it opened a path I have never stopped following since.
I had read "You can be a Stock Market Genius" from the same author in 1998, found it interesting but saw little practical use beside the spin-offs chapter.
The "Little Book" was different. Indeed it showed that concentrated portfolios selected by multi-dimension models could beat the markets by a wide margin.
For the laymen, J. Greenblatt describes a model to find stocks with a reasonable earning yield and a high return on invested capital (ROIC). He is looking for cheap stocks which are using their capital efficiently. To combine both attributes, he ranks the full universe on cheapness and on capital use efficiency, add both ranks and rank the combined ranking (Financials and utilities are excluded).
Earning Yield = EBIT/Enterprise Value
ROIC = EBIT/(Net Working Capital + Net PPE – Excess Cash)
Magic Formula = Rank(Rank(Earning Yield) + Rank(ROIC))
While I could describe the detailed breakdown of the various financial items in the above equations, I believe that anyone who is willing to use such models for real investments should read the book first to understand why he structured the formula as he did and dig into financial statements to find the various elements.
The only element he does not define precisely is "excess cash". This omission might not seem much, but it is. Many investors have tried to replicate the "Magic Formula" and nobody, as far as we know, succeeded.
We are getting between 65-85% of the top 50 picks right (we do not consider stocks which have not their primary trading security in the US when screening the US market) in the above 50 mio, above 250 mio, above 1 bio, above 10 bio category. We have yet to find anyone getting closer but would love to hear about it if someone does!
There are several potential reasons for discrepancies. Our calculation of the excess cash might be off, we are taking minority interest into our calculation both at the nominator and denominator and we are not using the same database.
While many backtest have been performed on the US market and the current picks of the original formula are freely available, there hasn't been much publication on the Magic Formula internationally.
More than 10 years ago, the always excellent James Montier backtested a simplified version in "The little note that beat the markets".
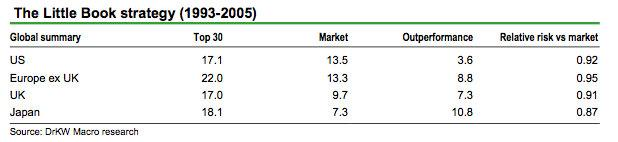
The results were good but what was also important, is that the outperformance was not linear. The Magic Formula had underperformed in 40% of the years in the US for example.
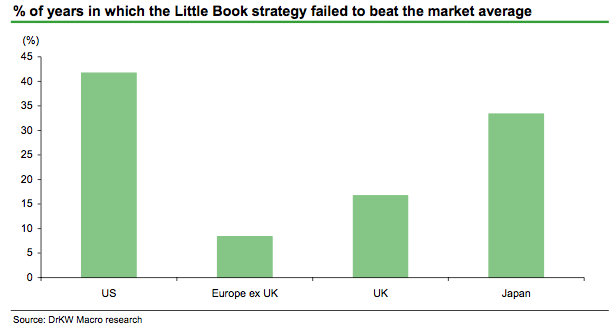
This is particularly important now when the value factor has been underperforming for so long, weighting on the relative performance of the Magic Formula. If there was a time to invest following J. Greenblatt's precept, it would be now!
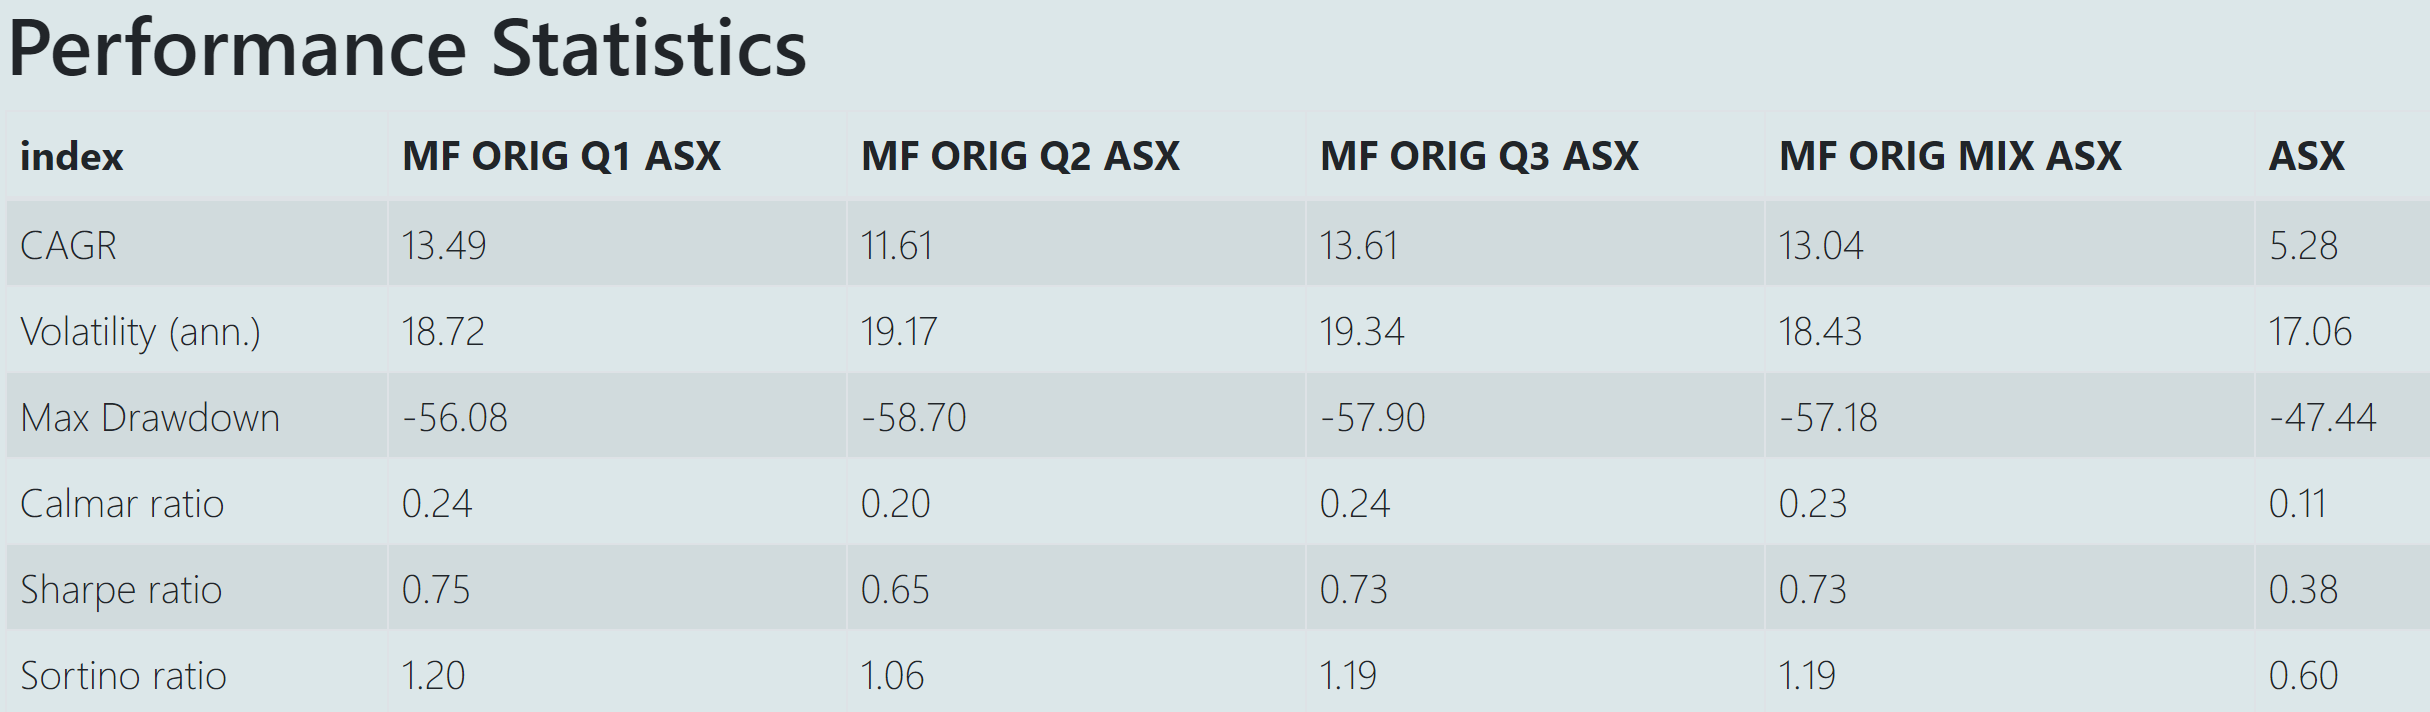
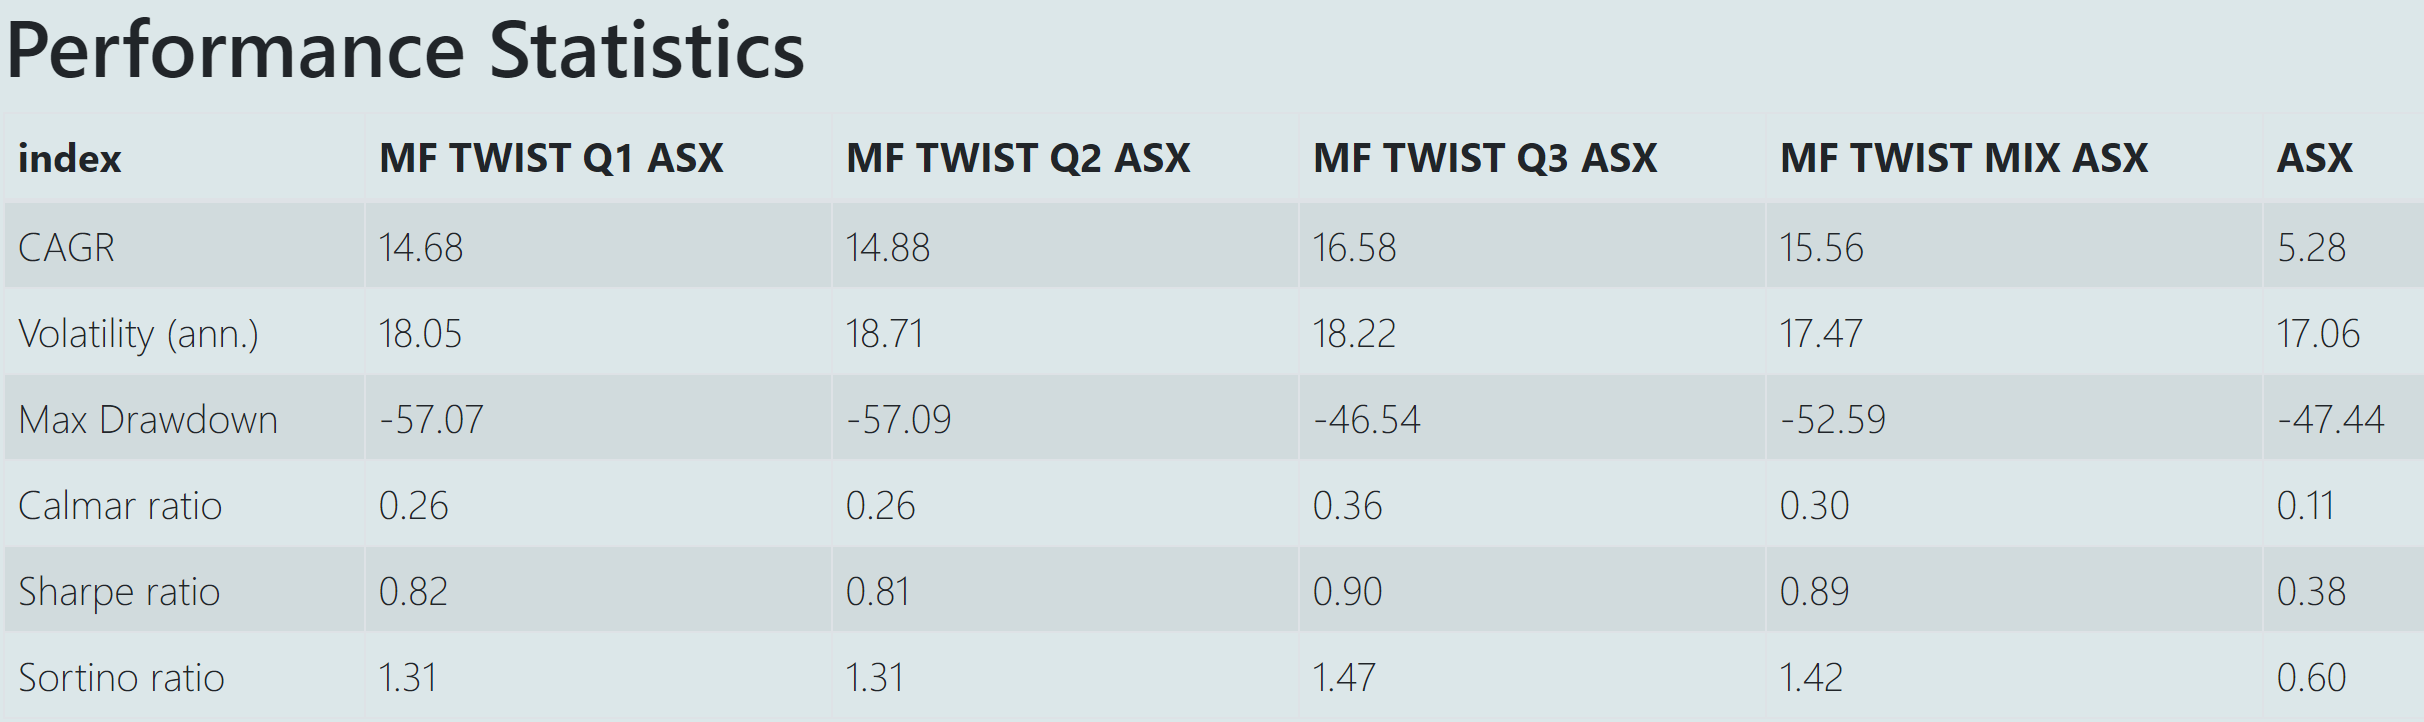
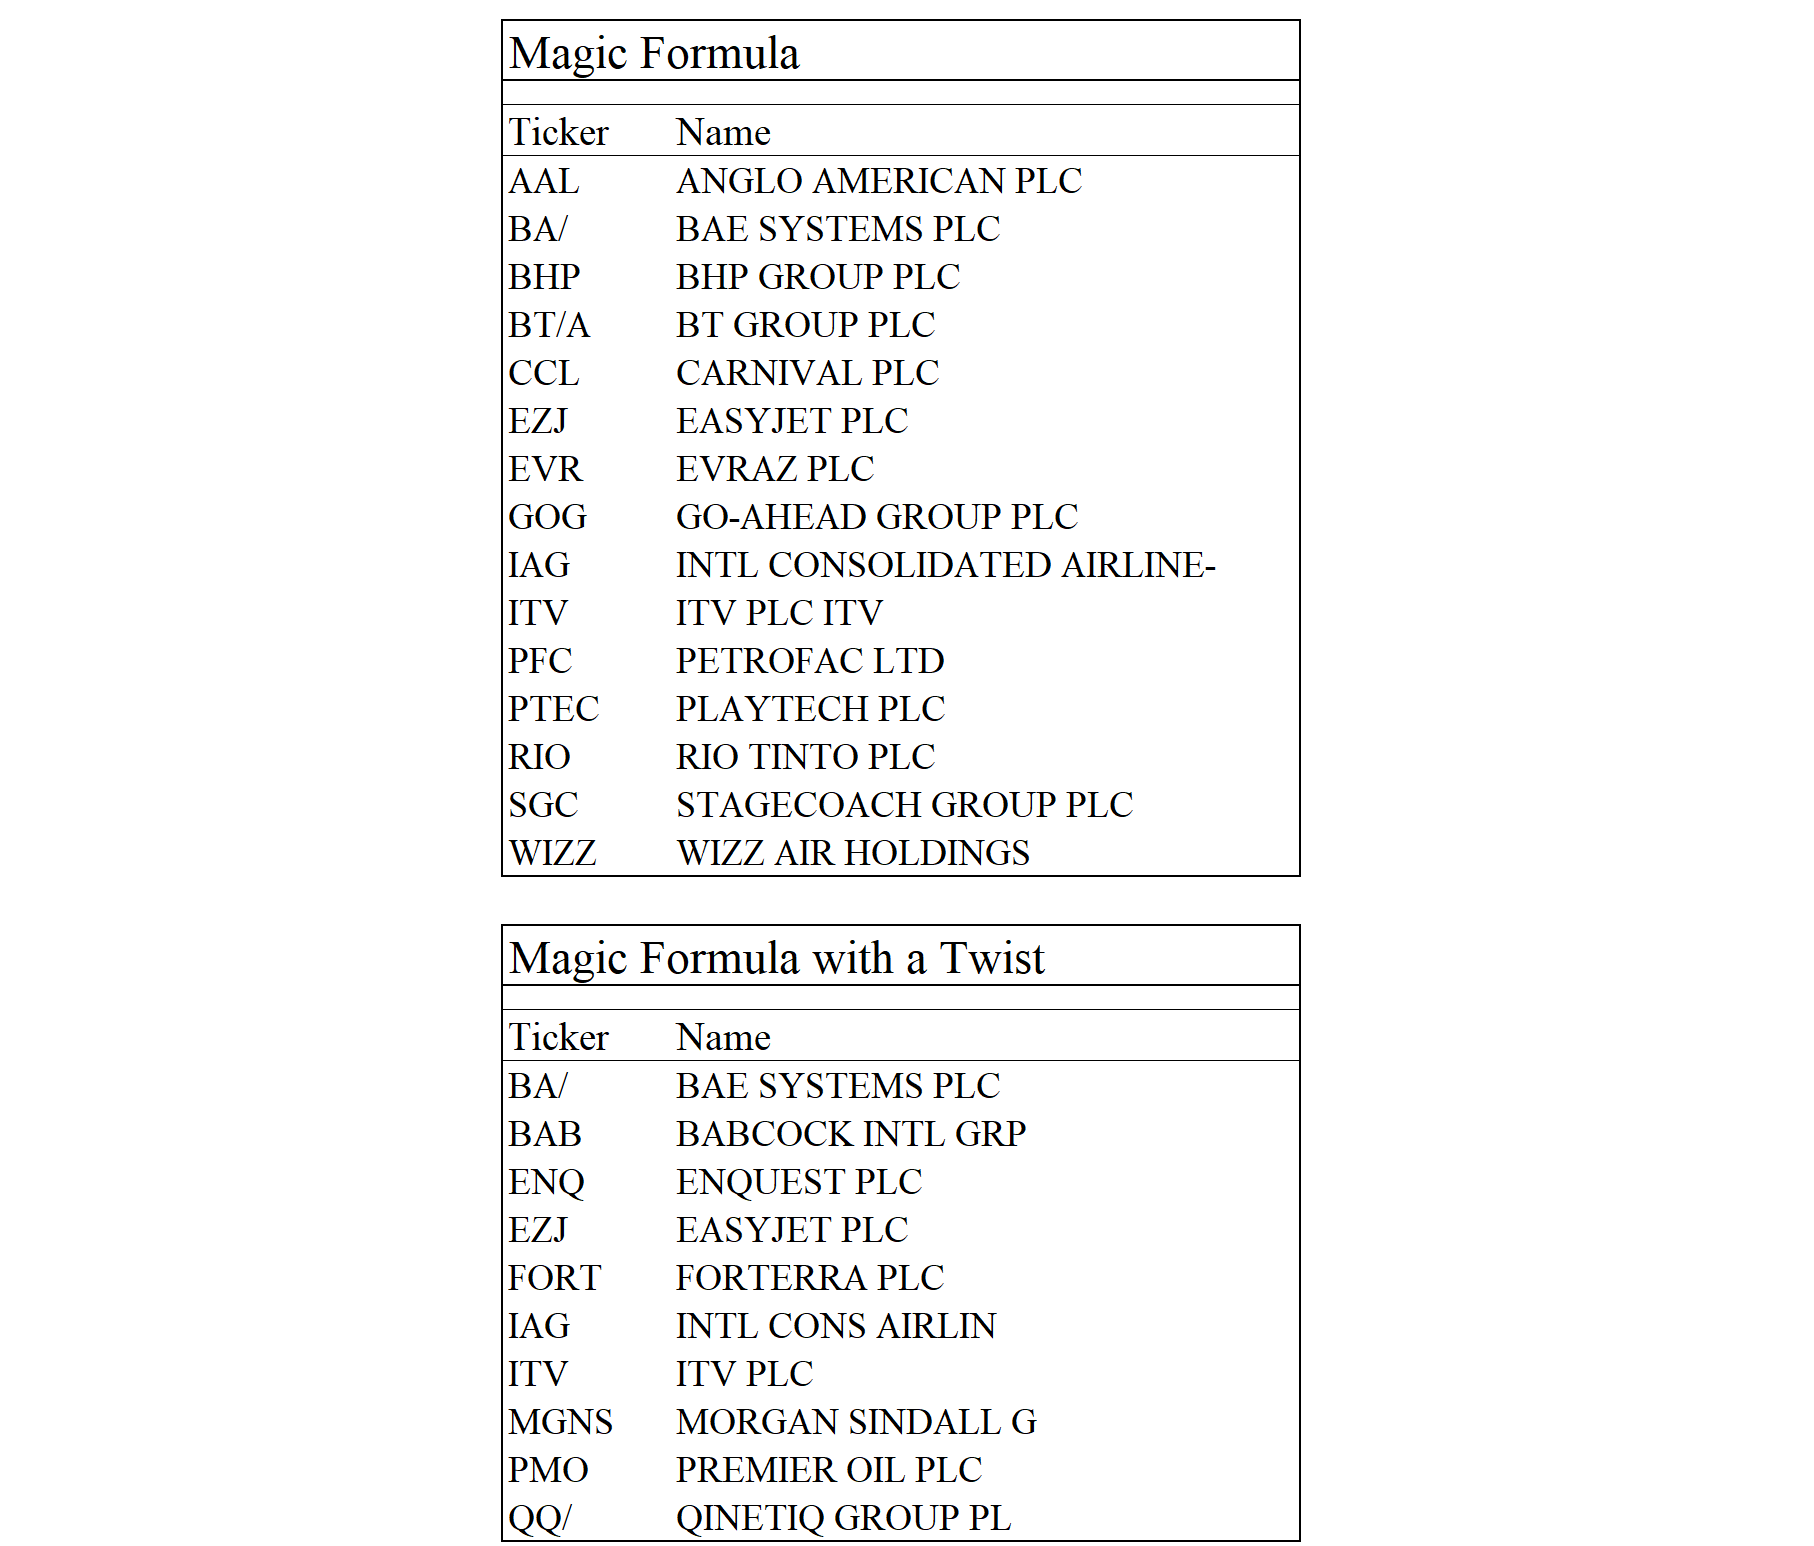
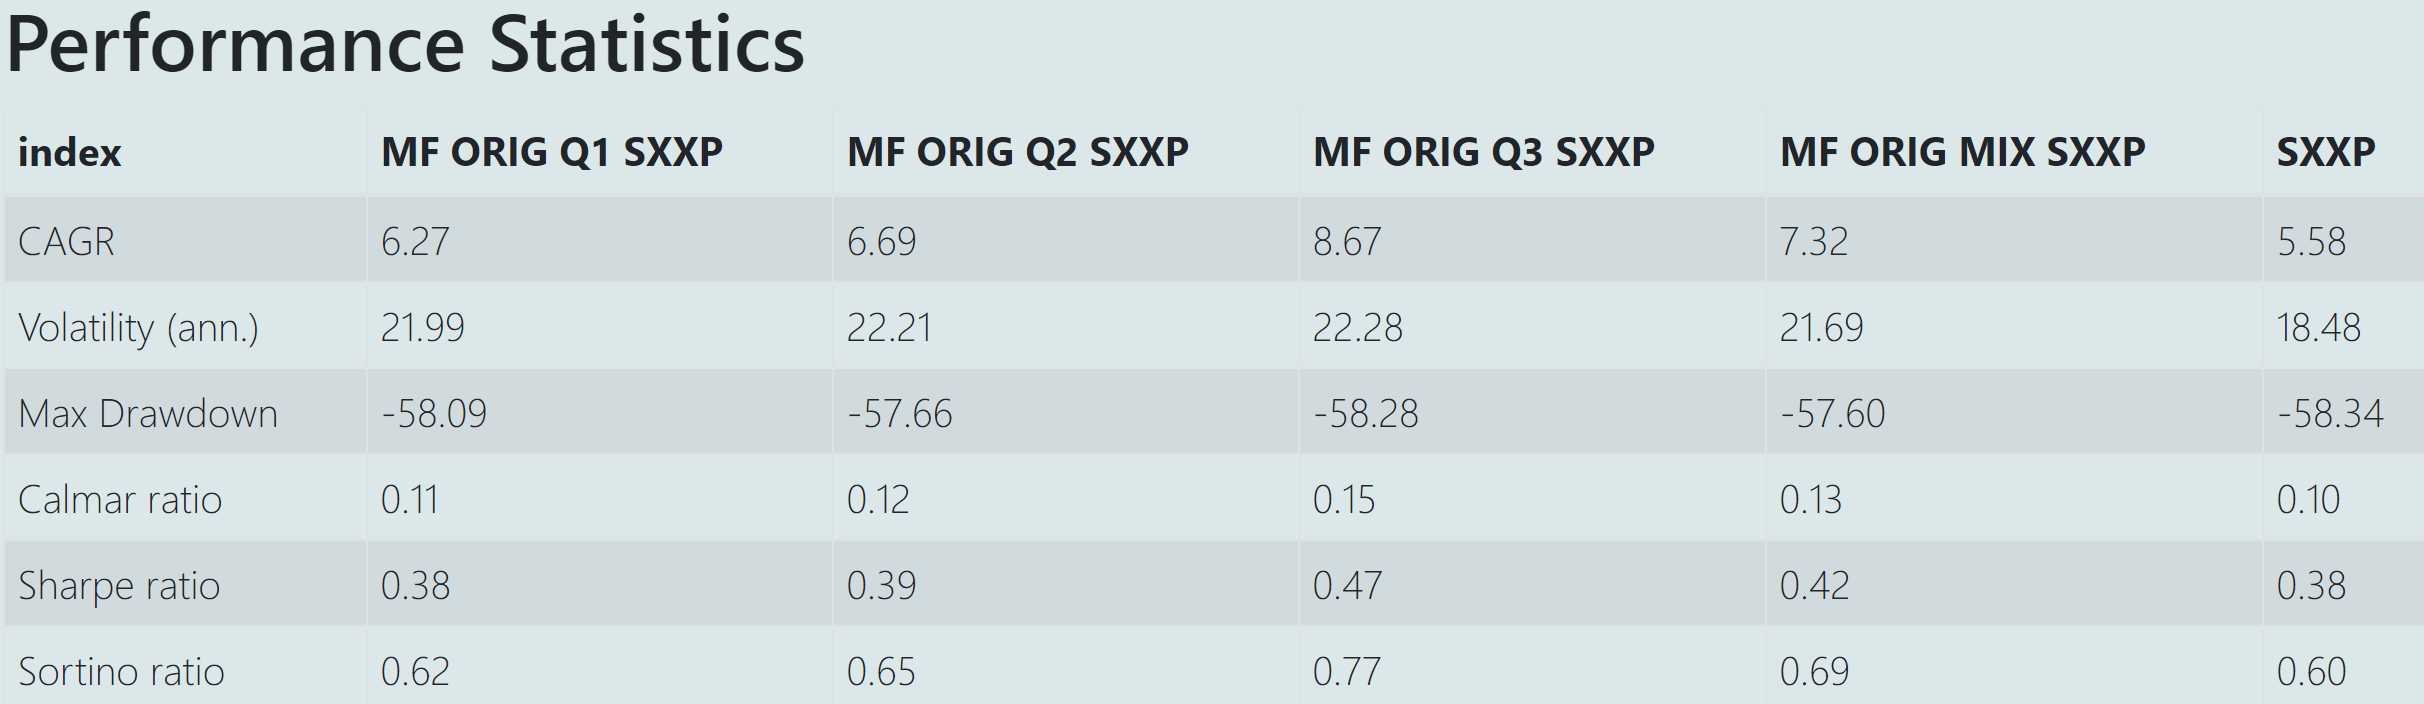
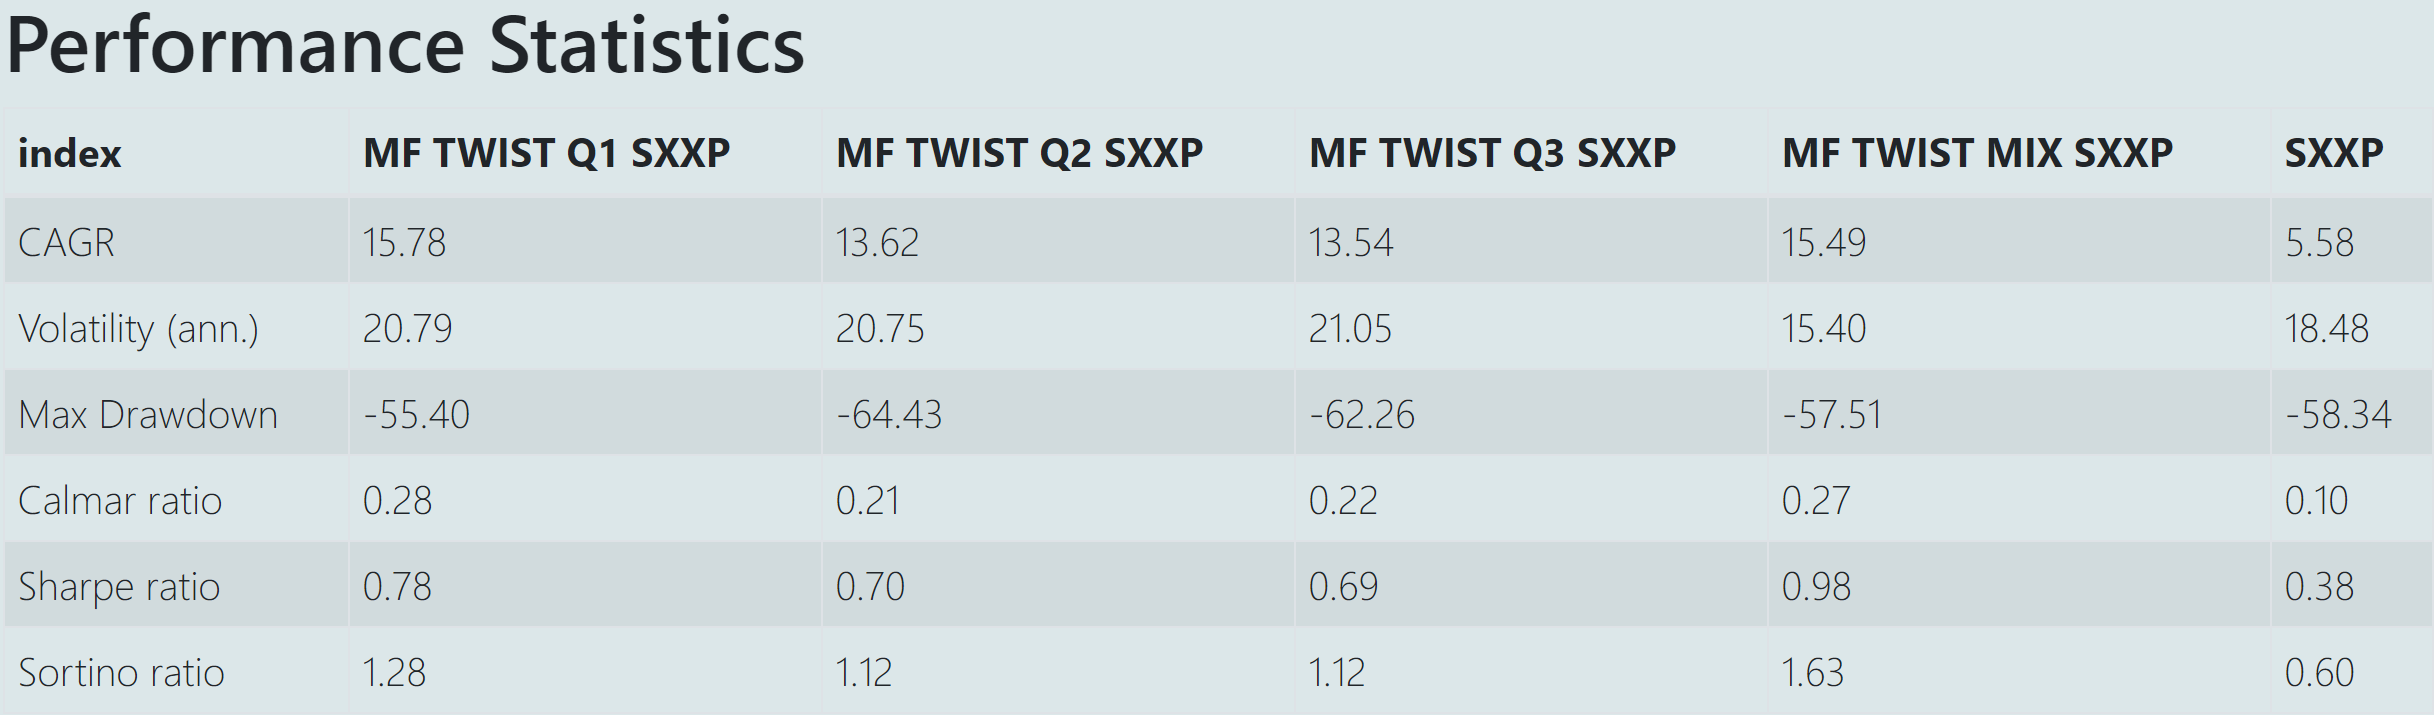
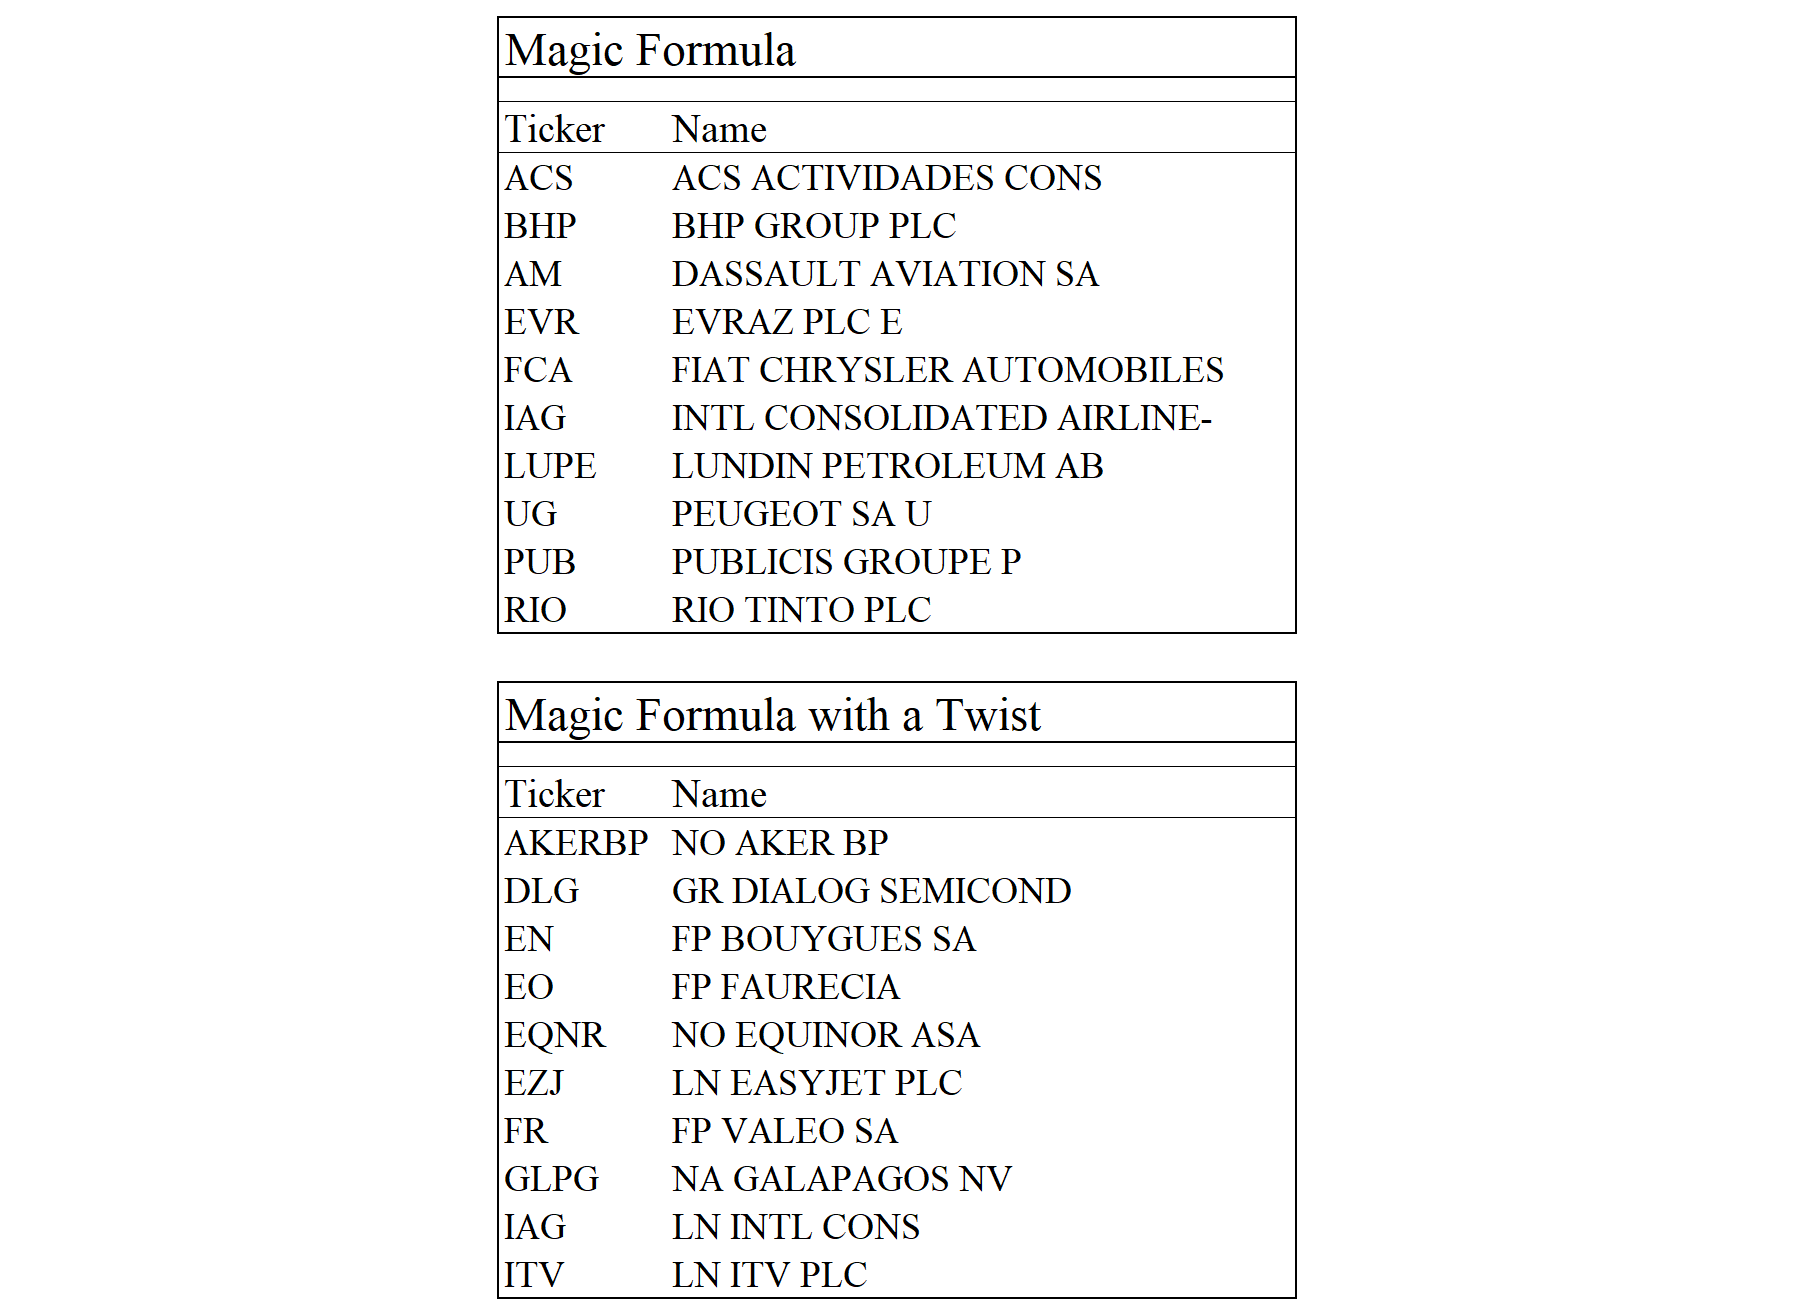
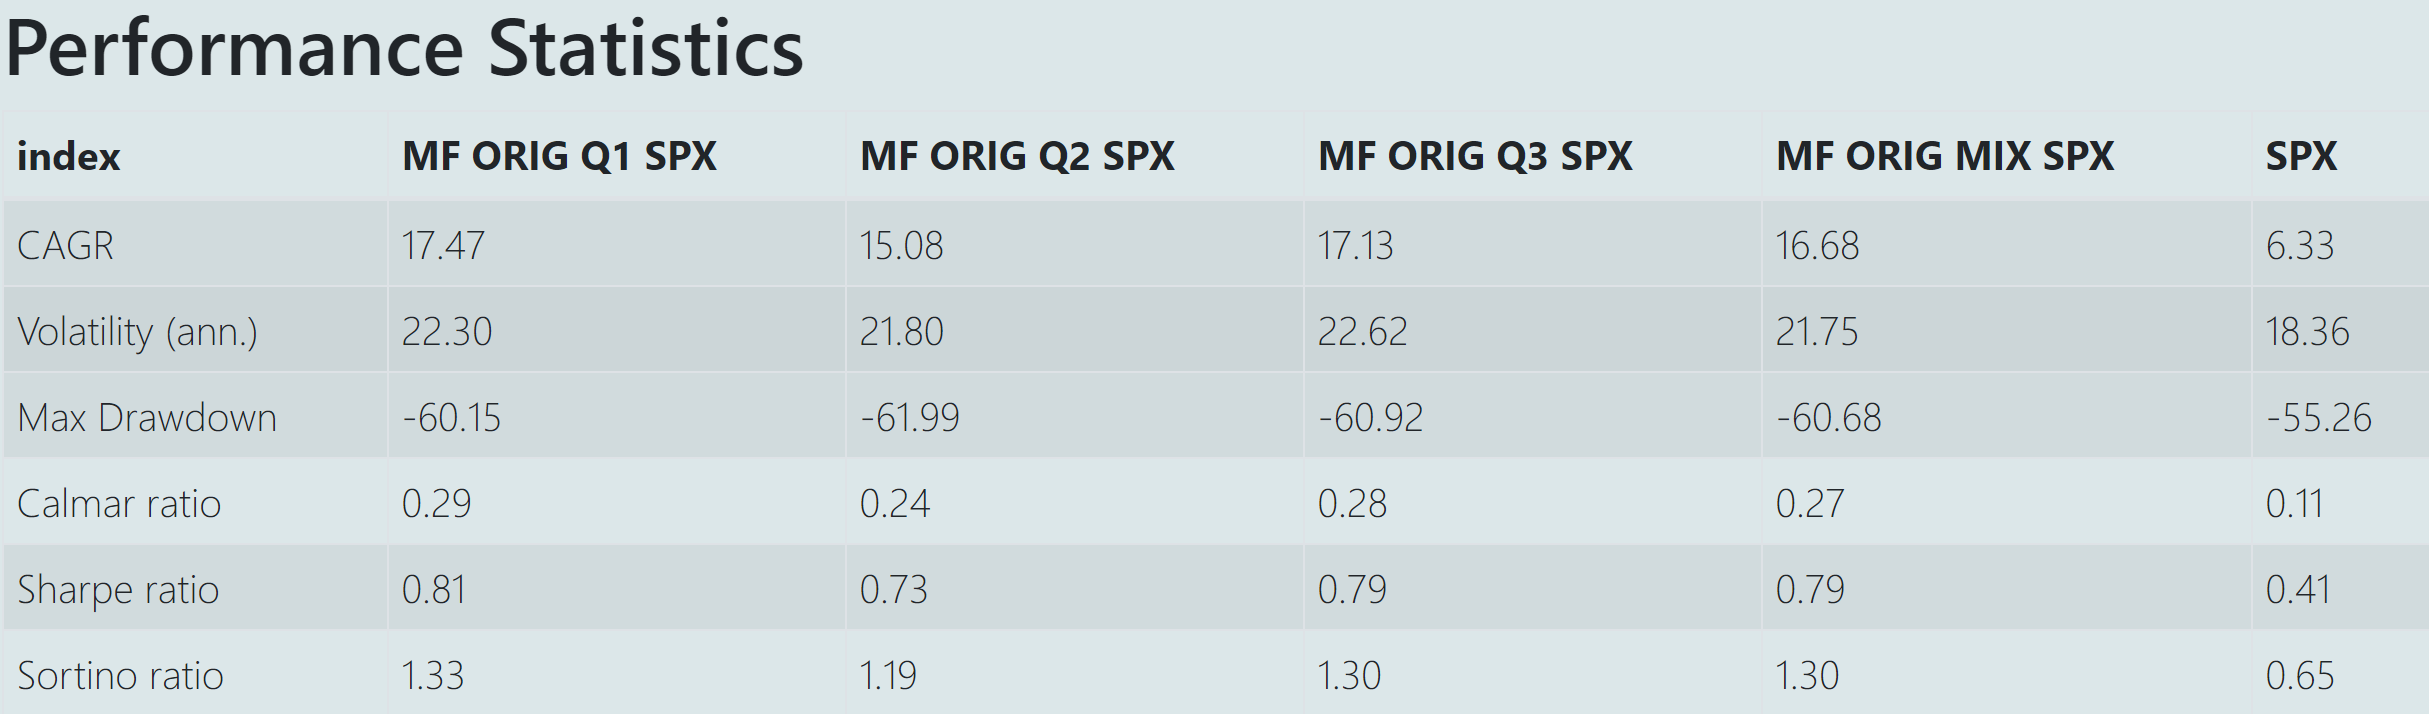
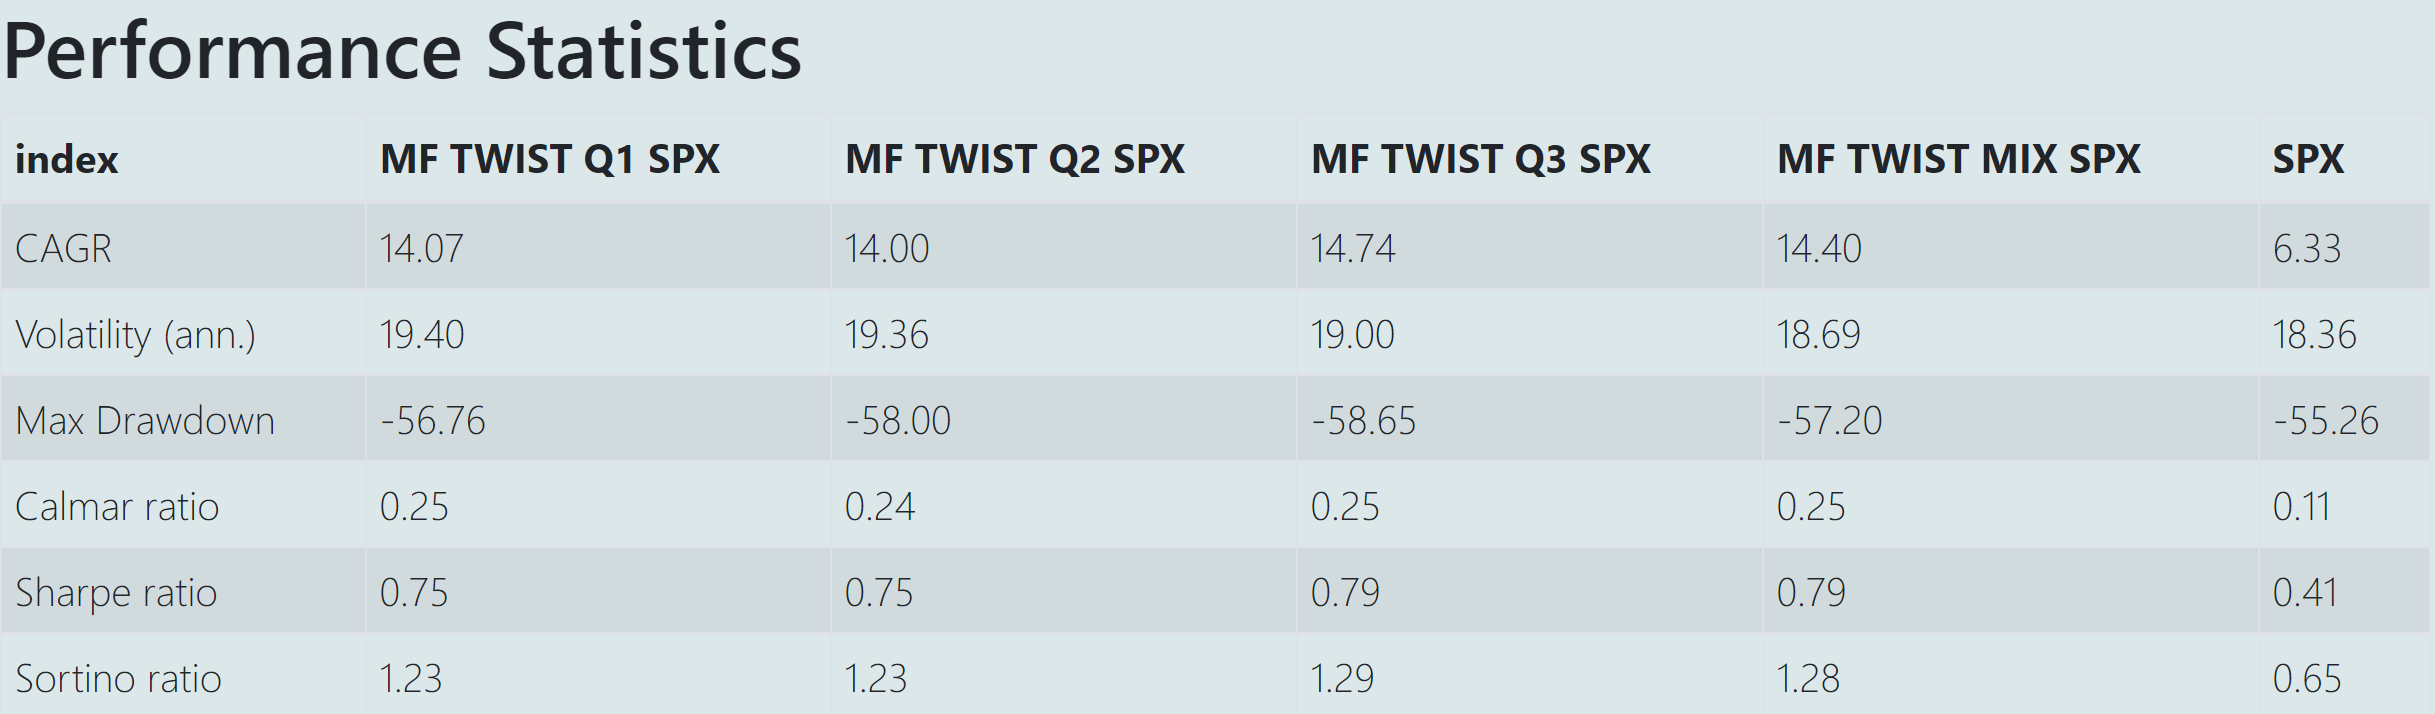
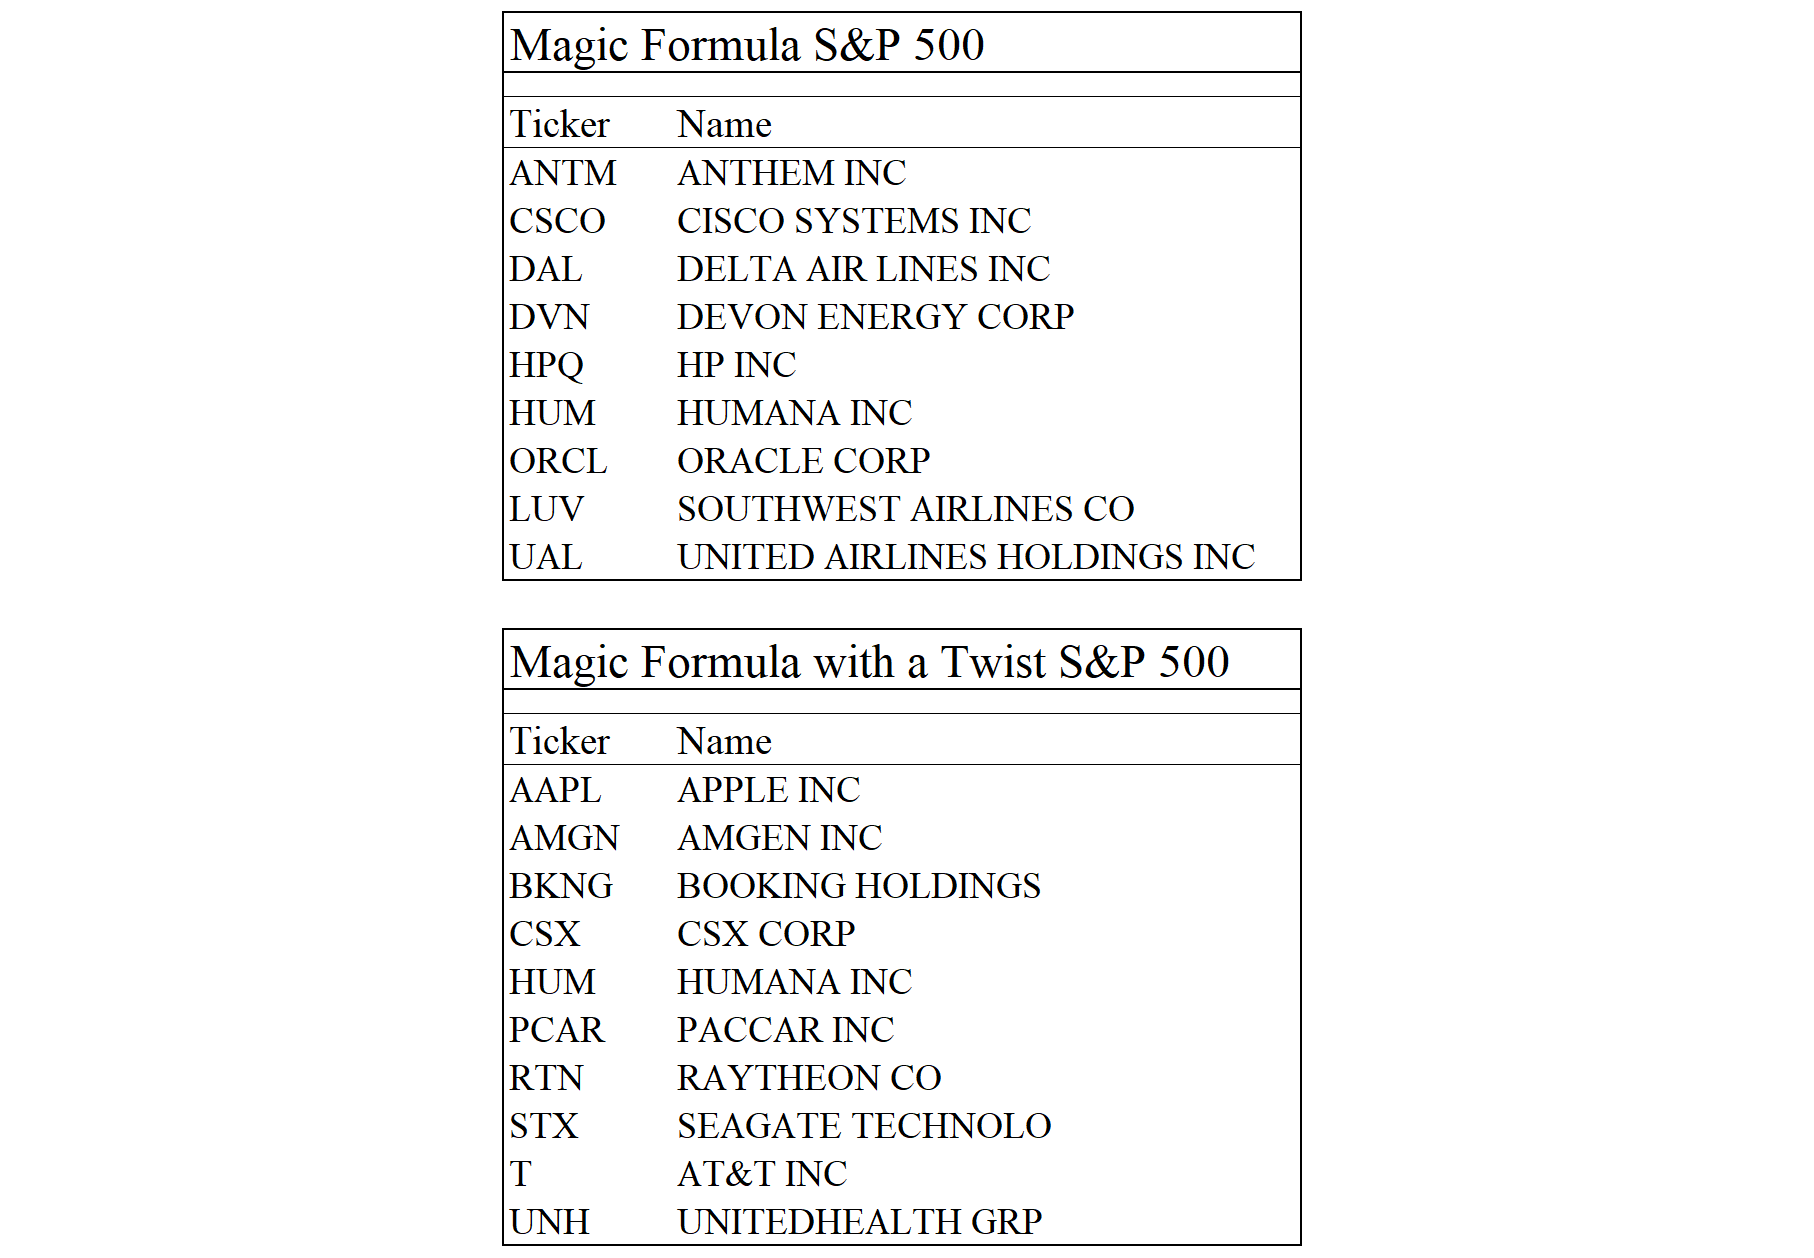
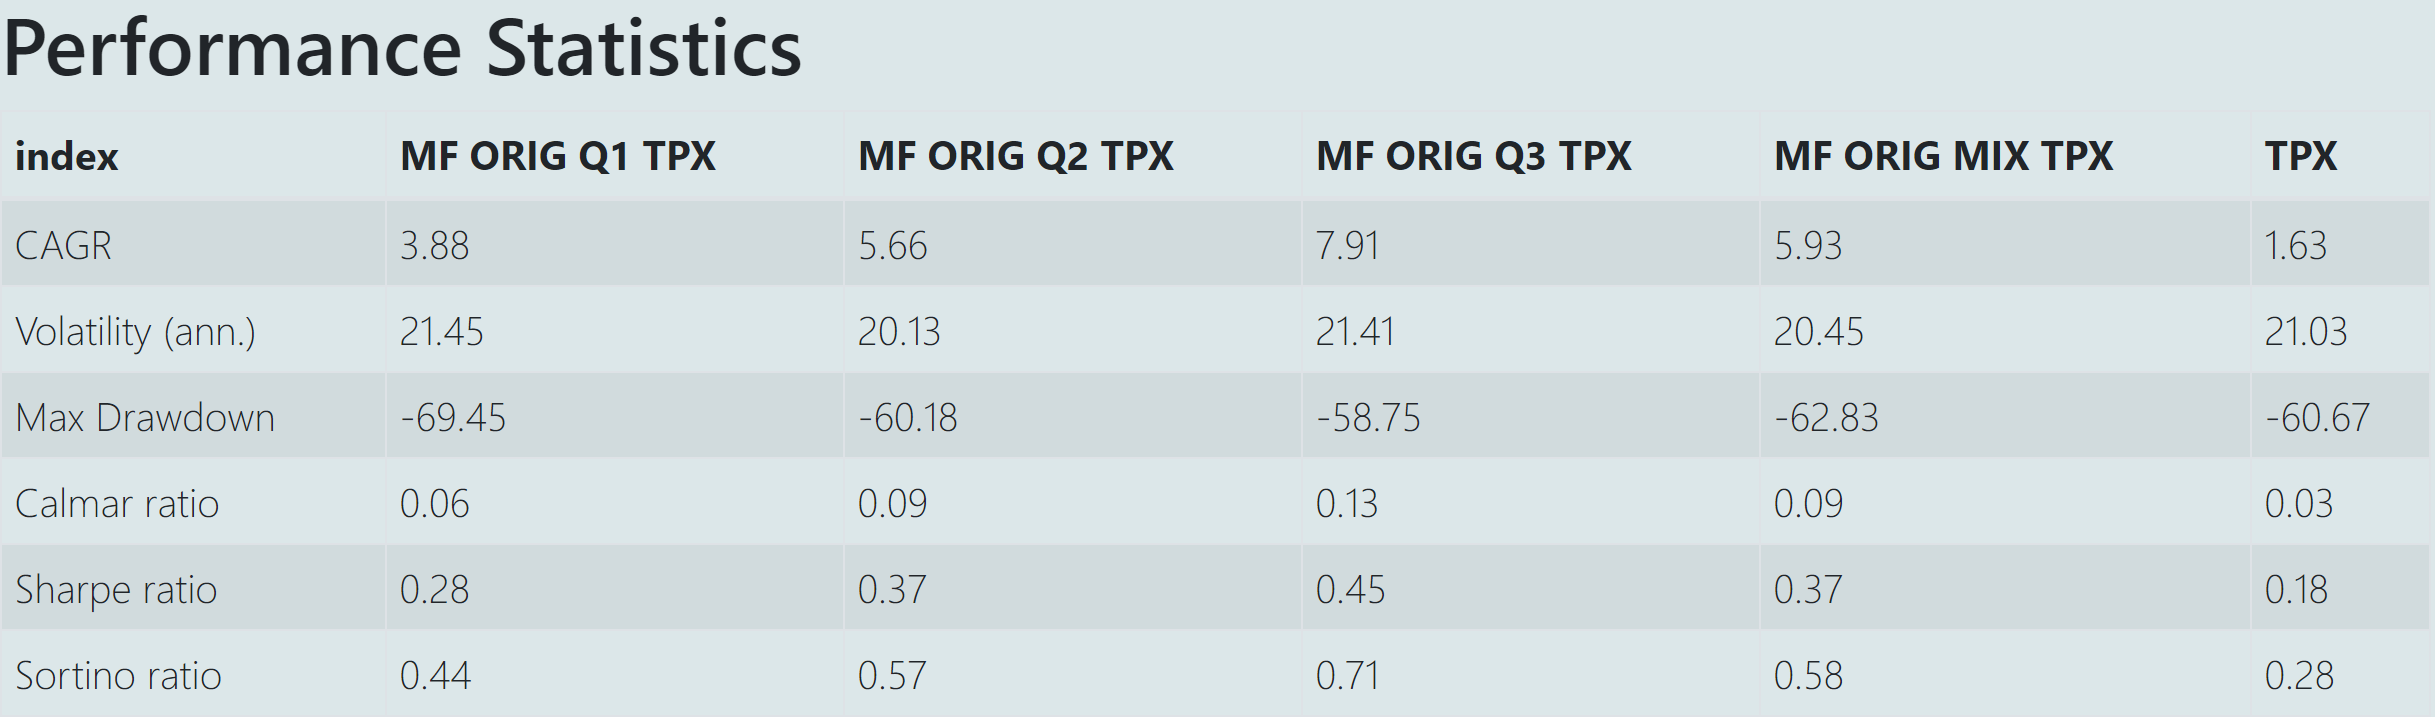
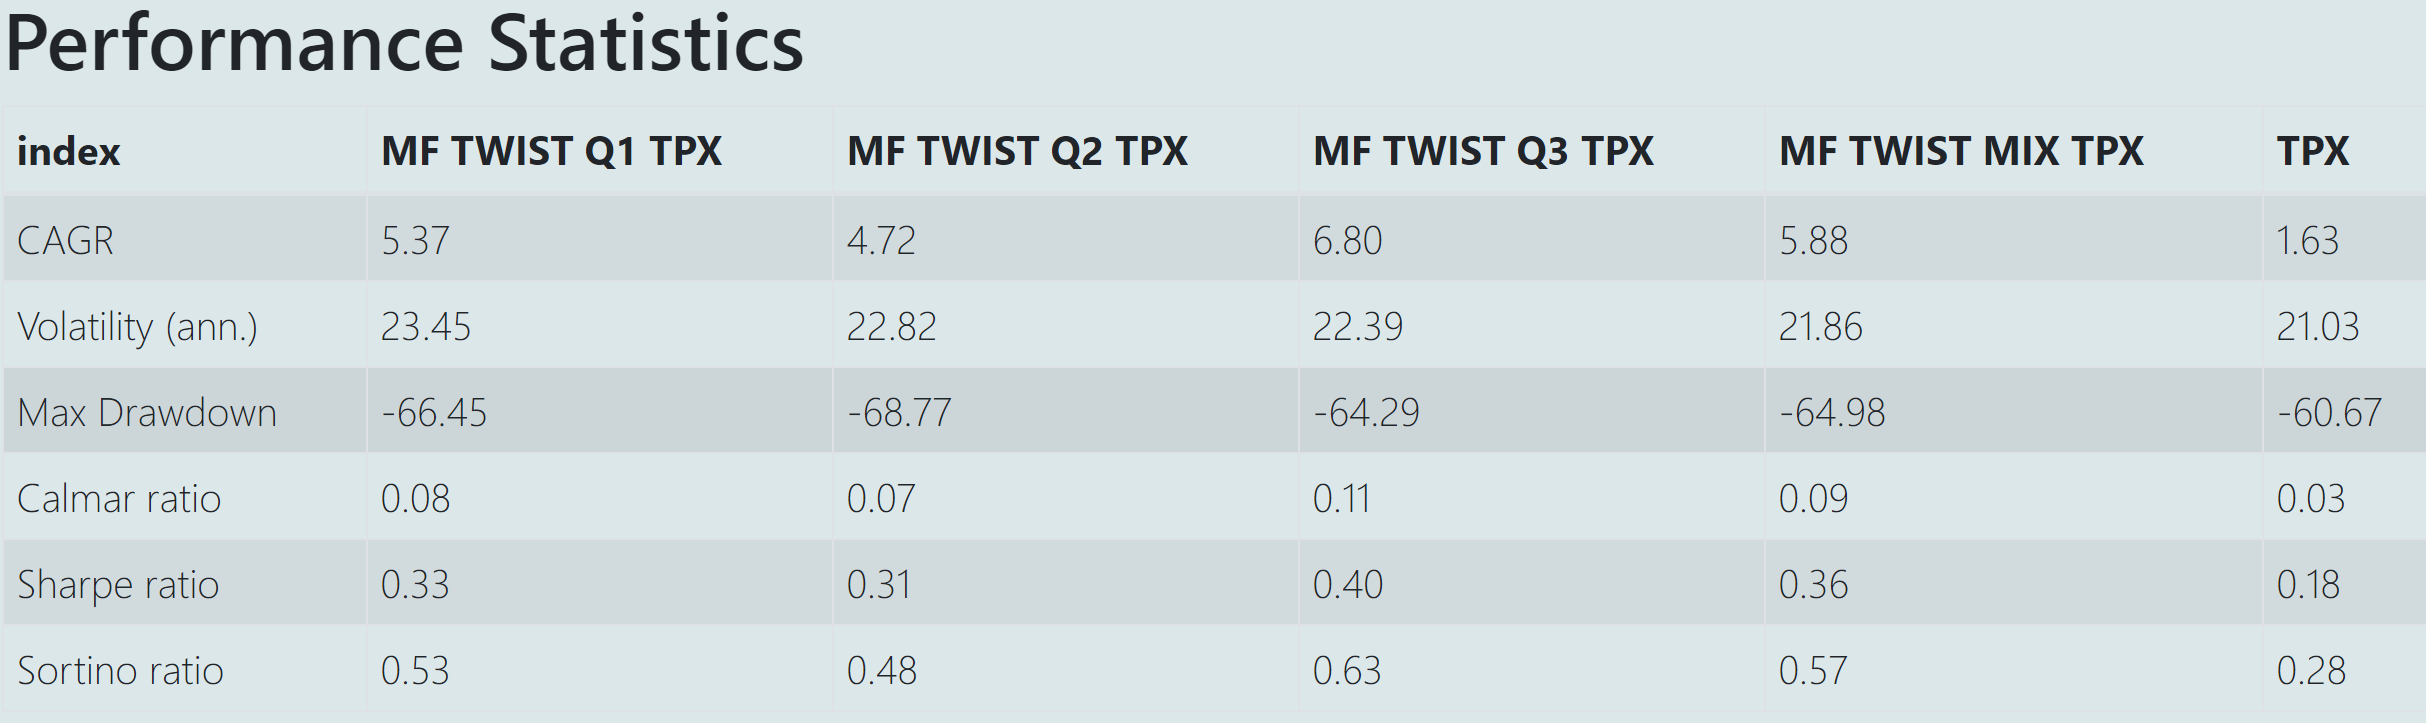
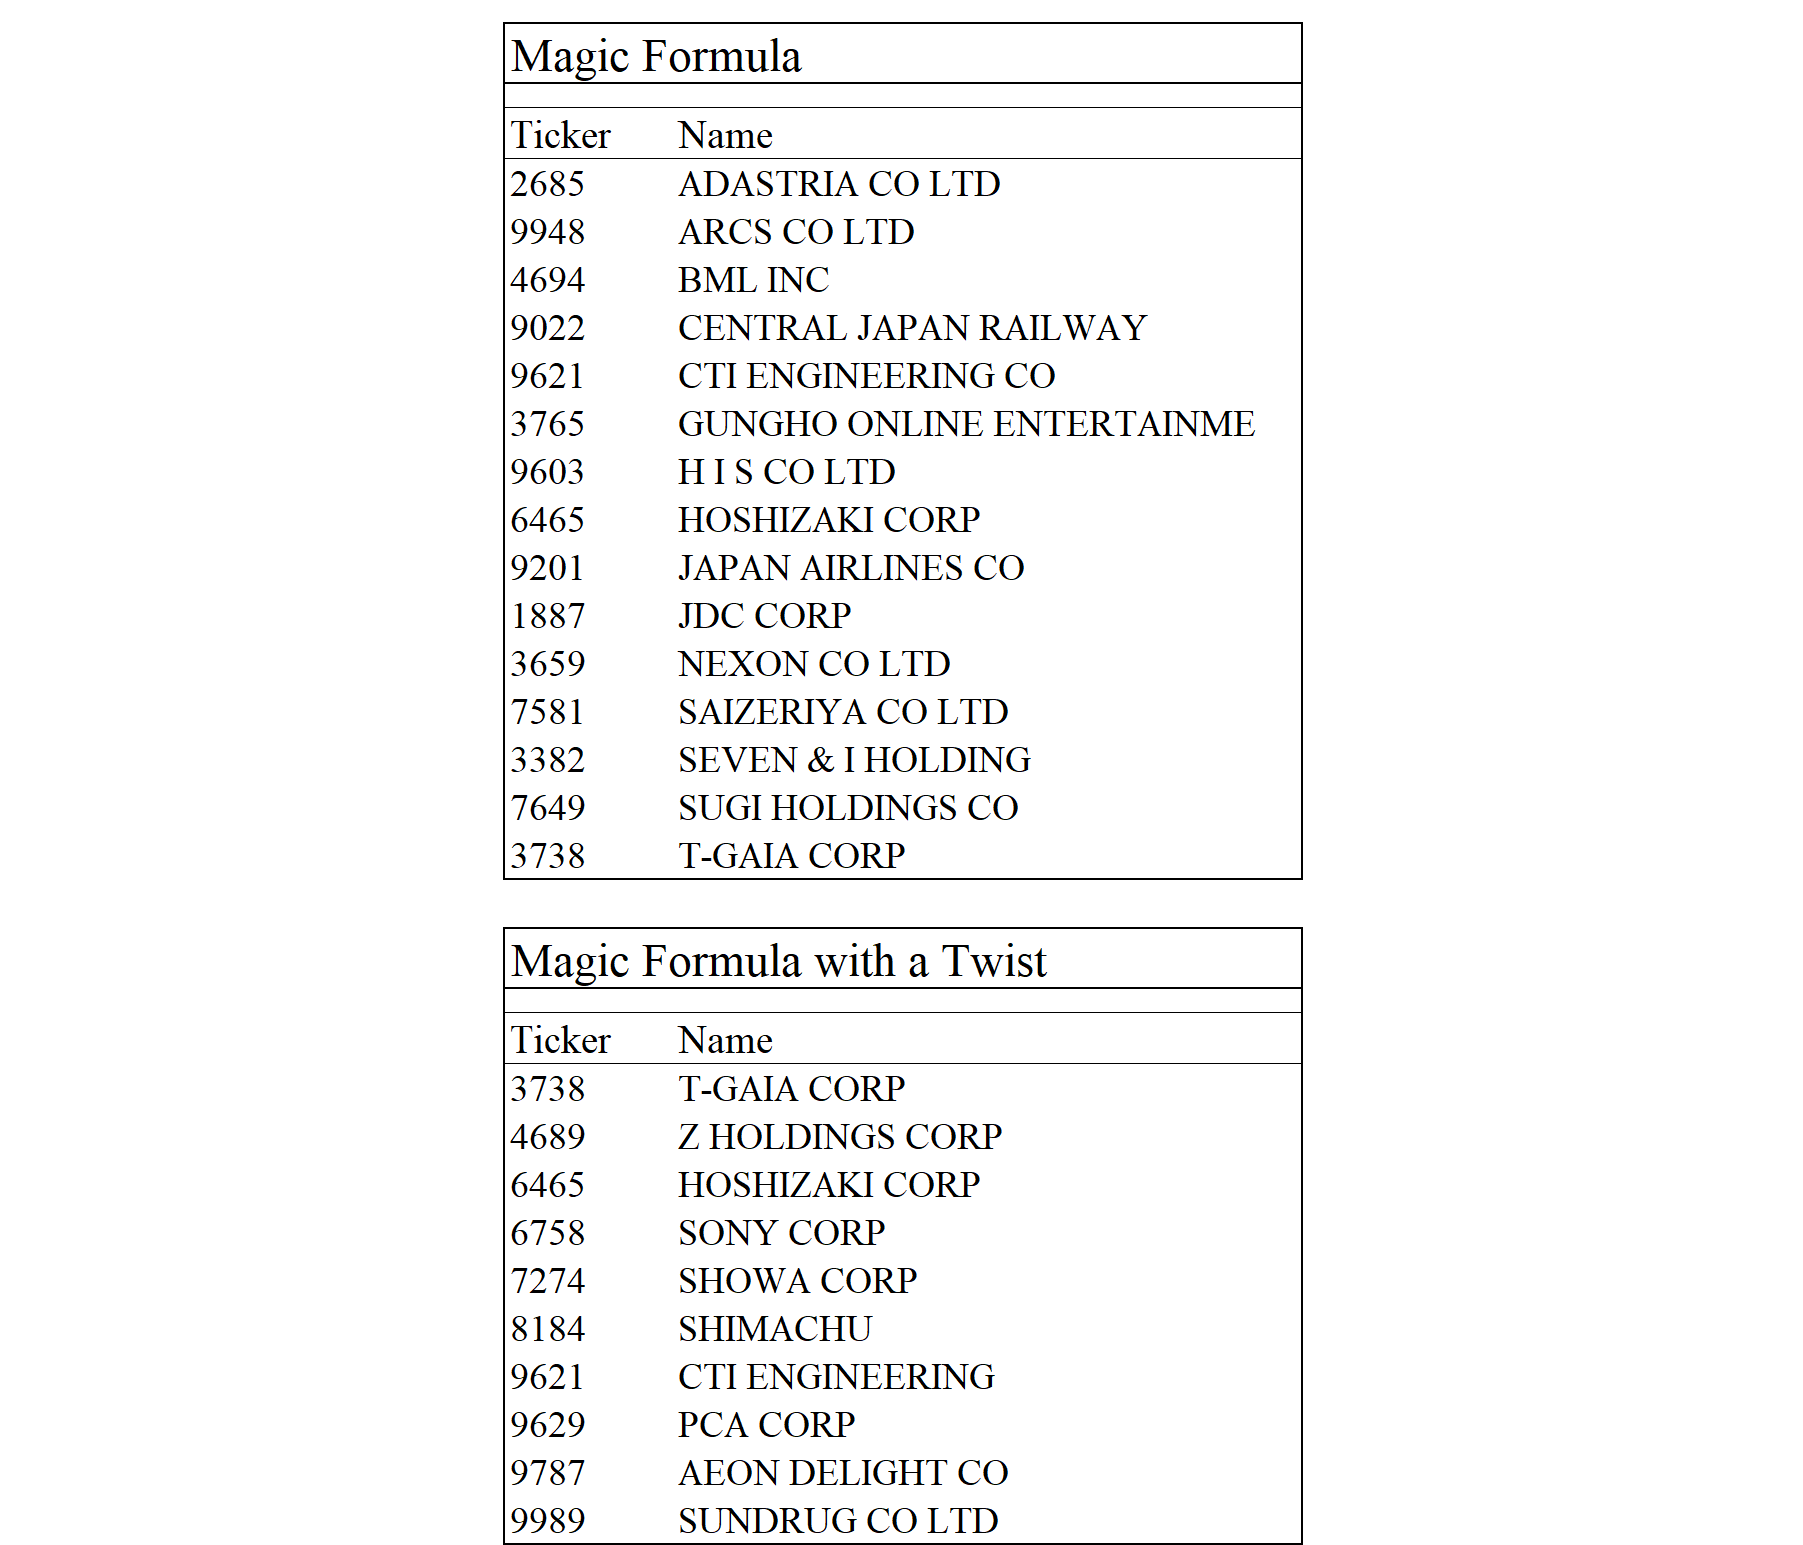
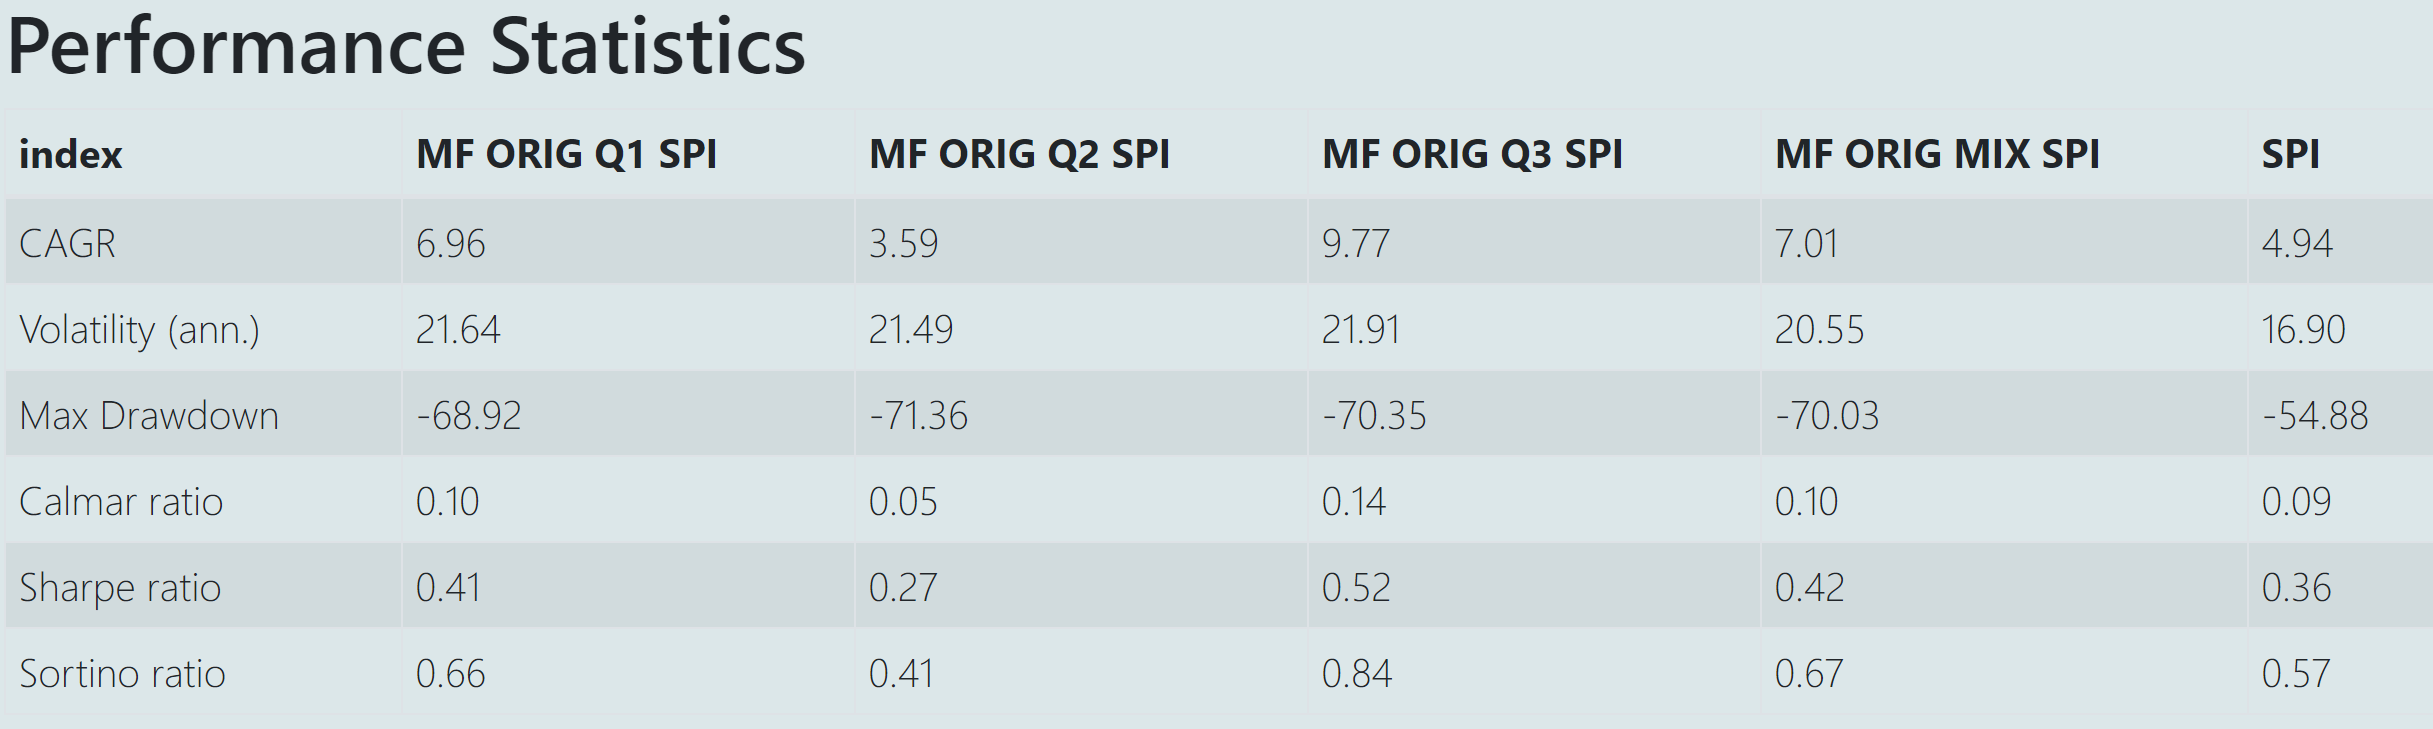
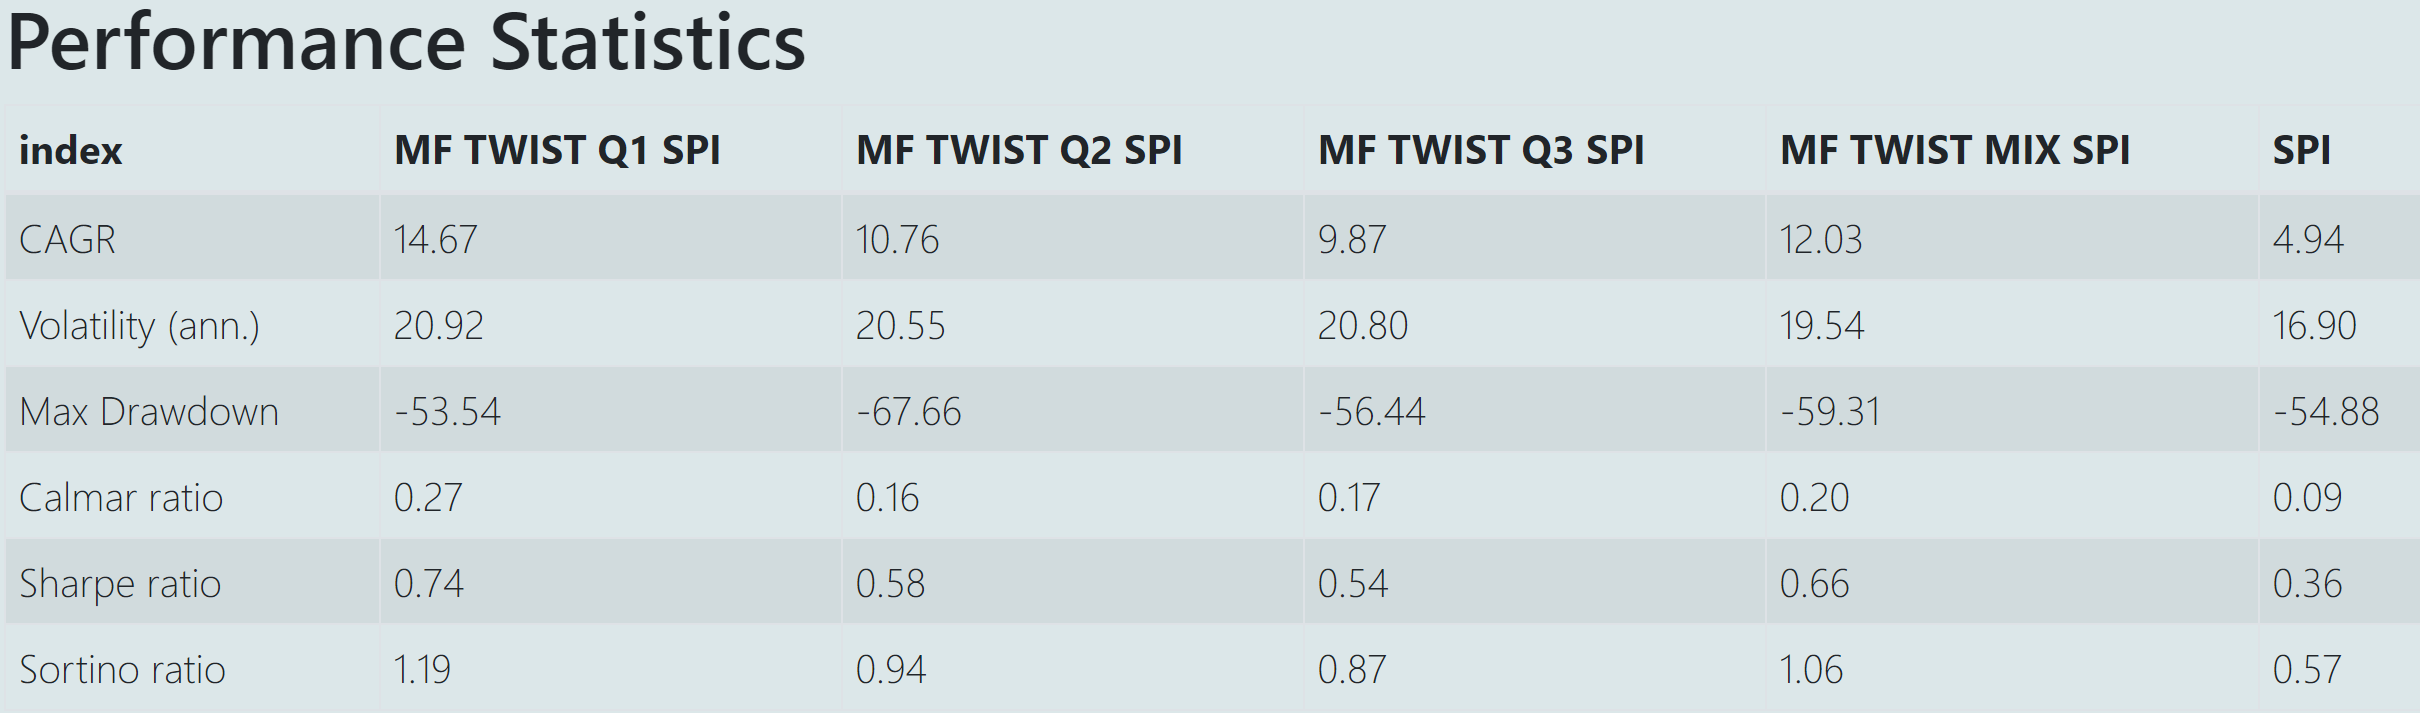
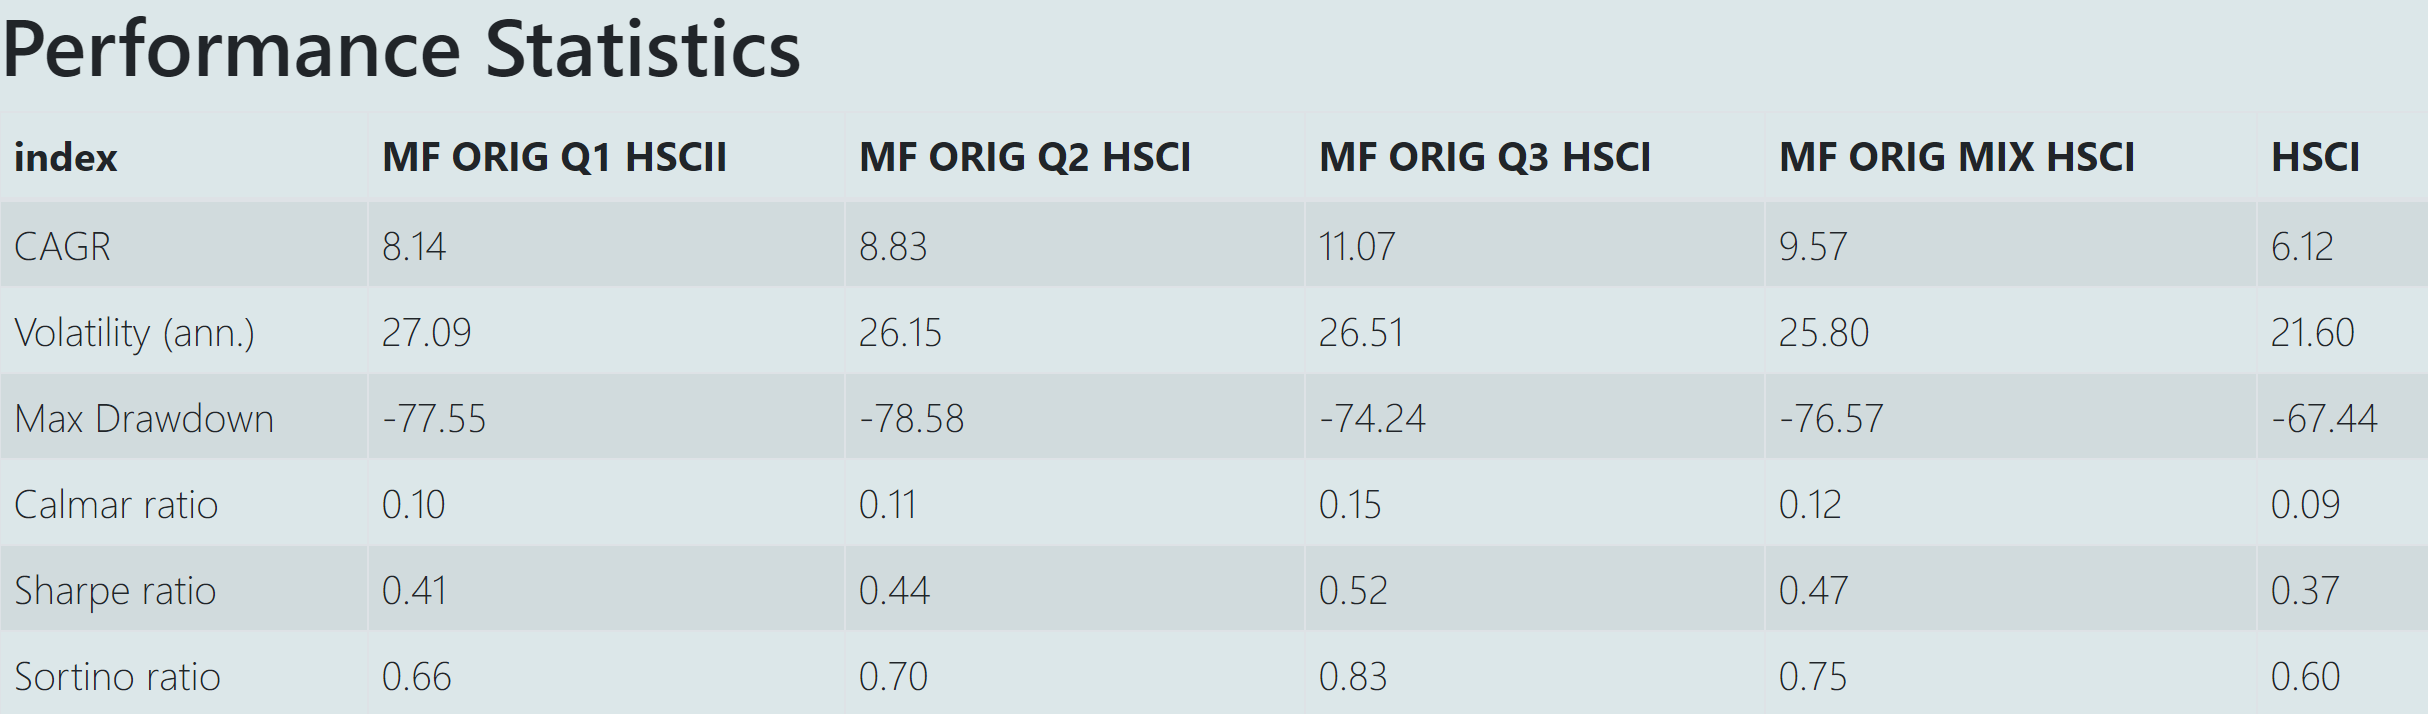
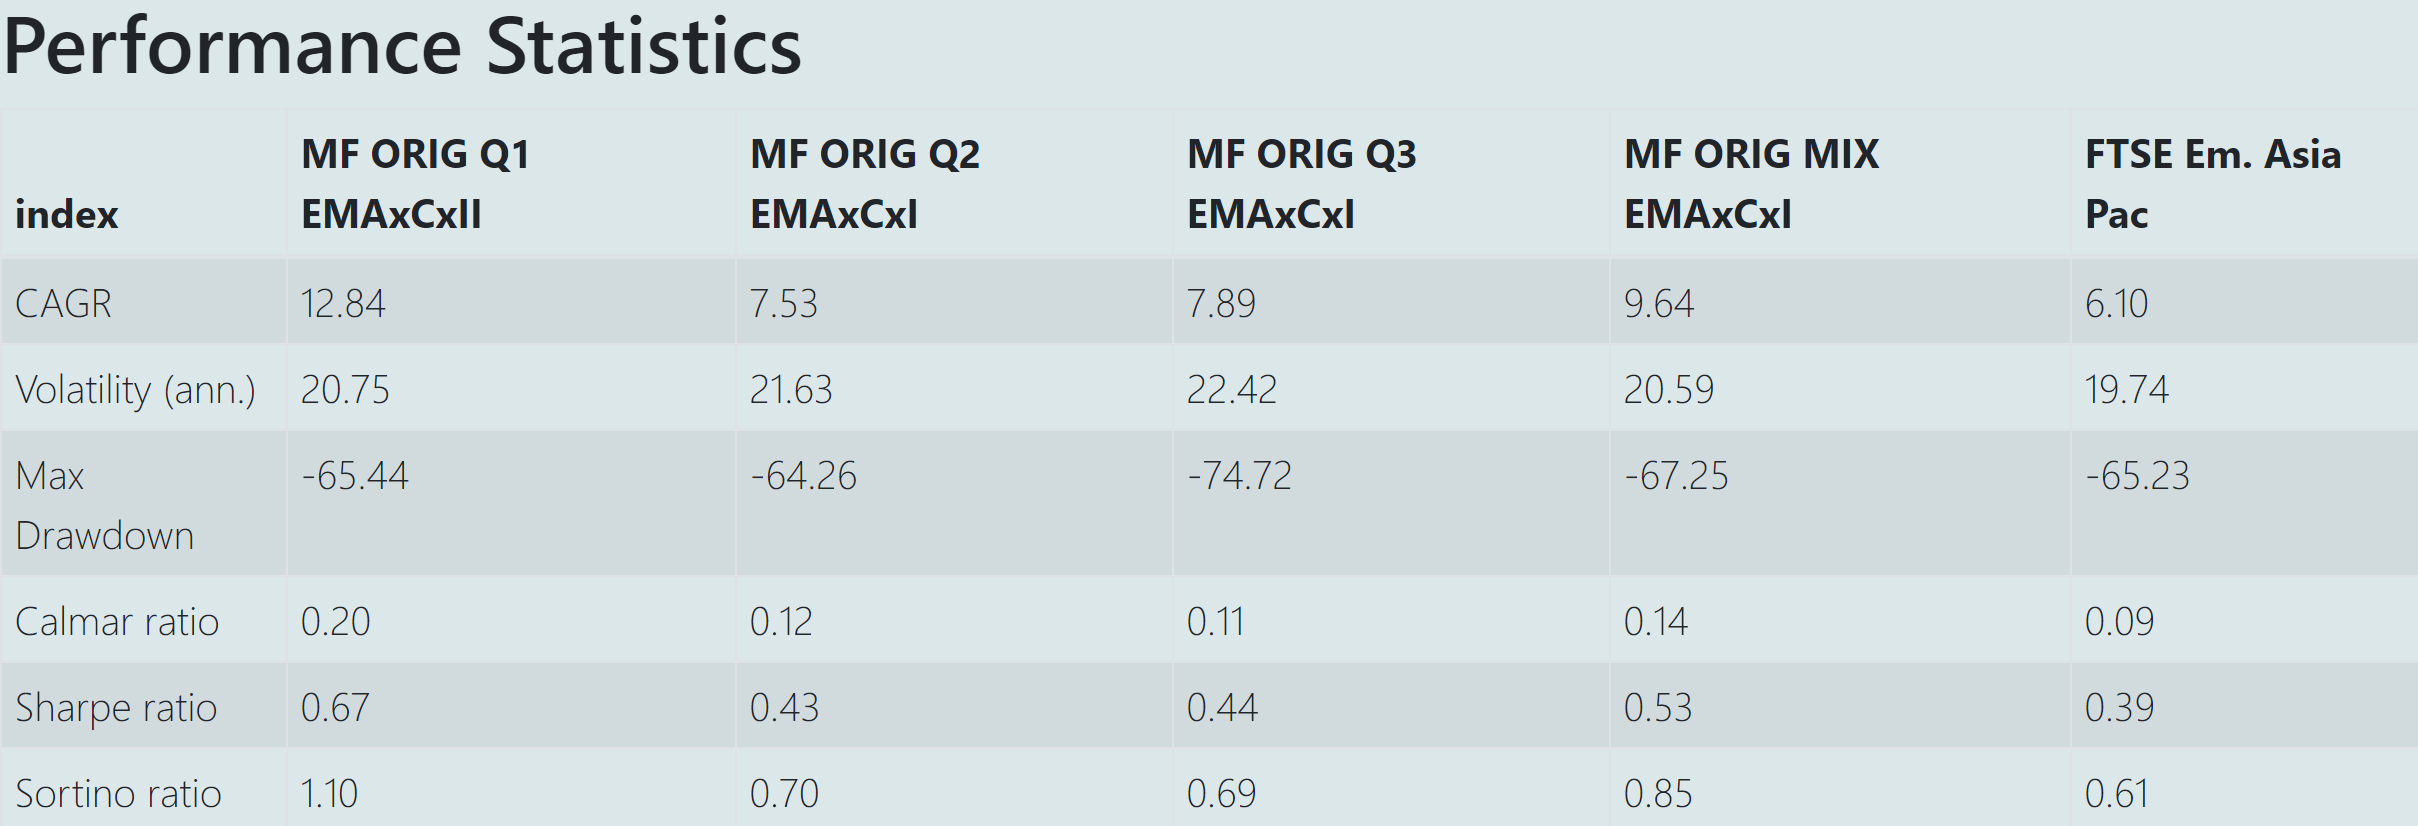
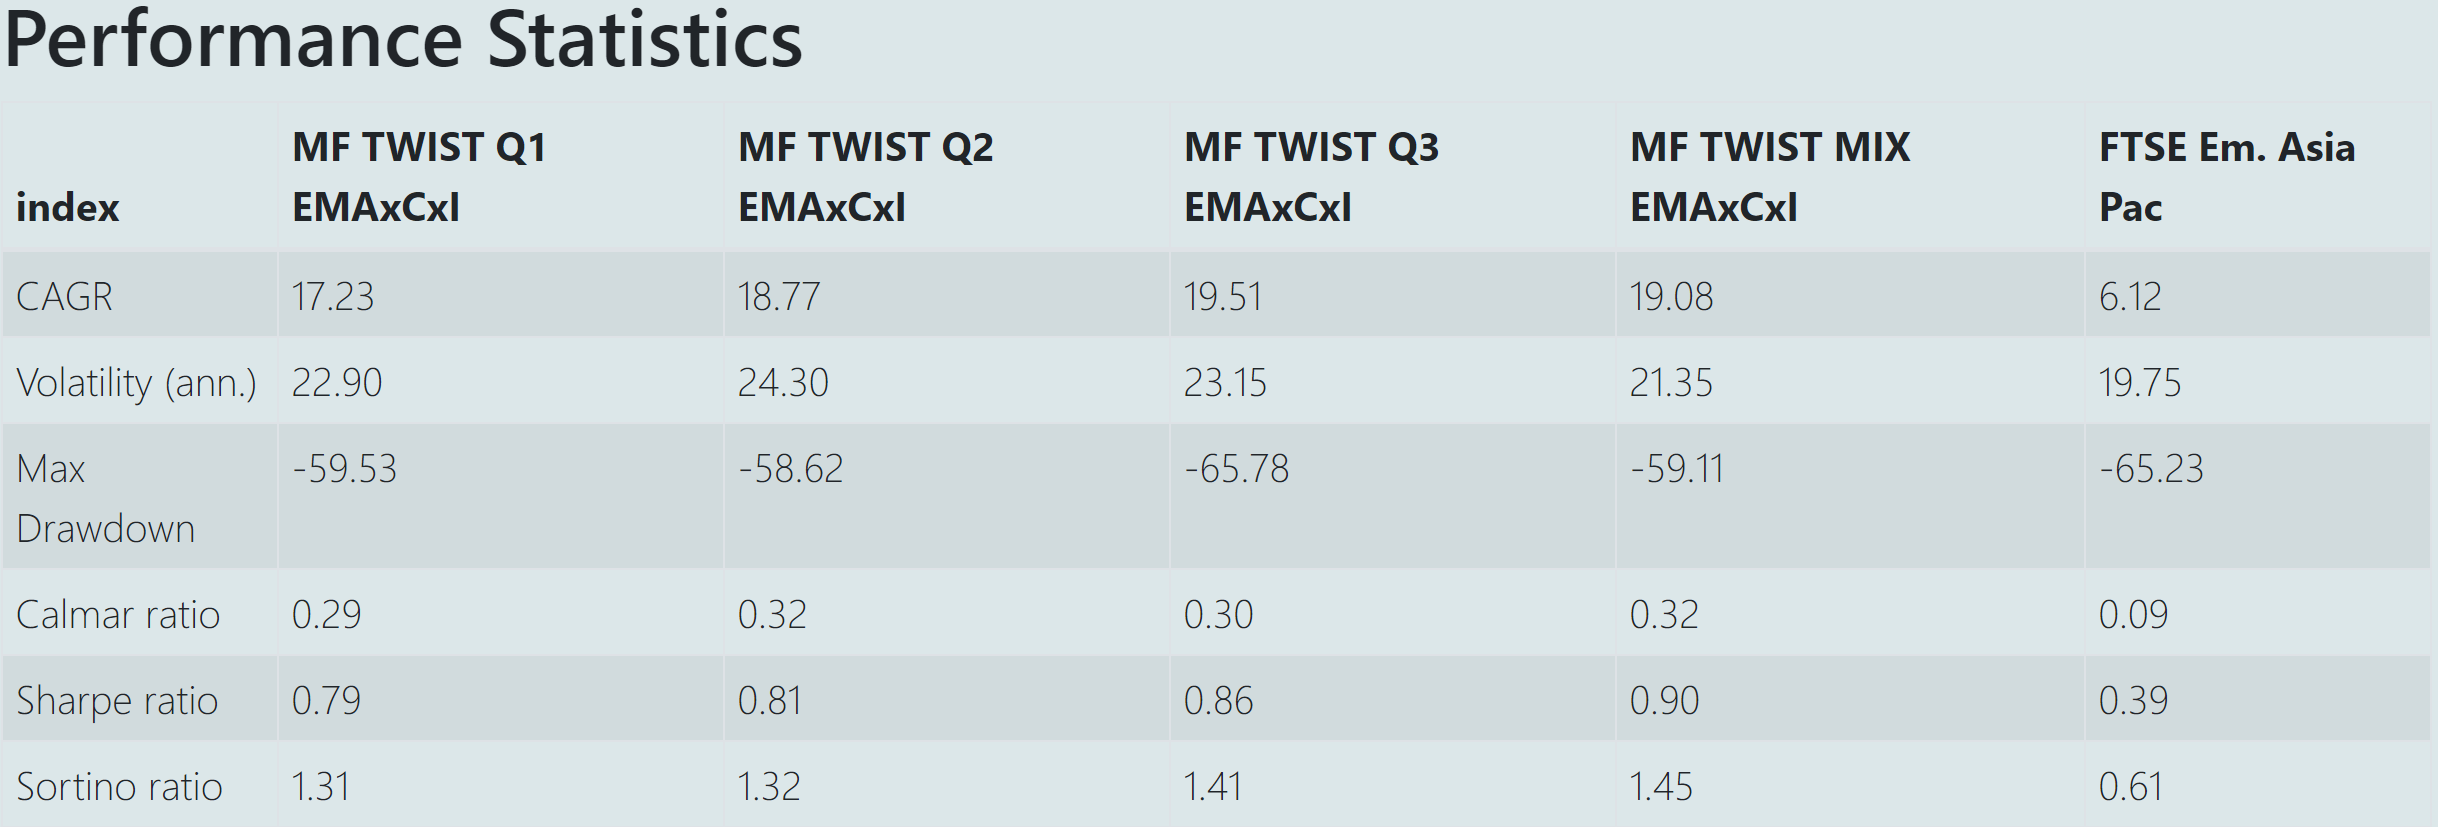
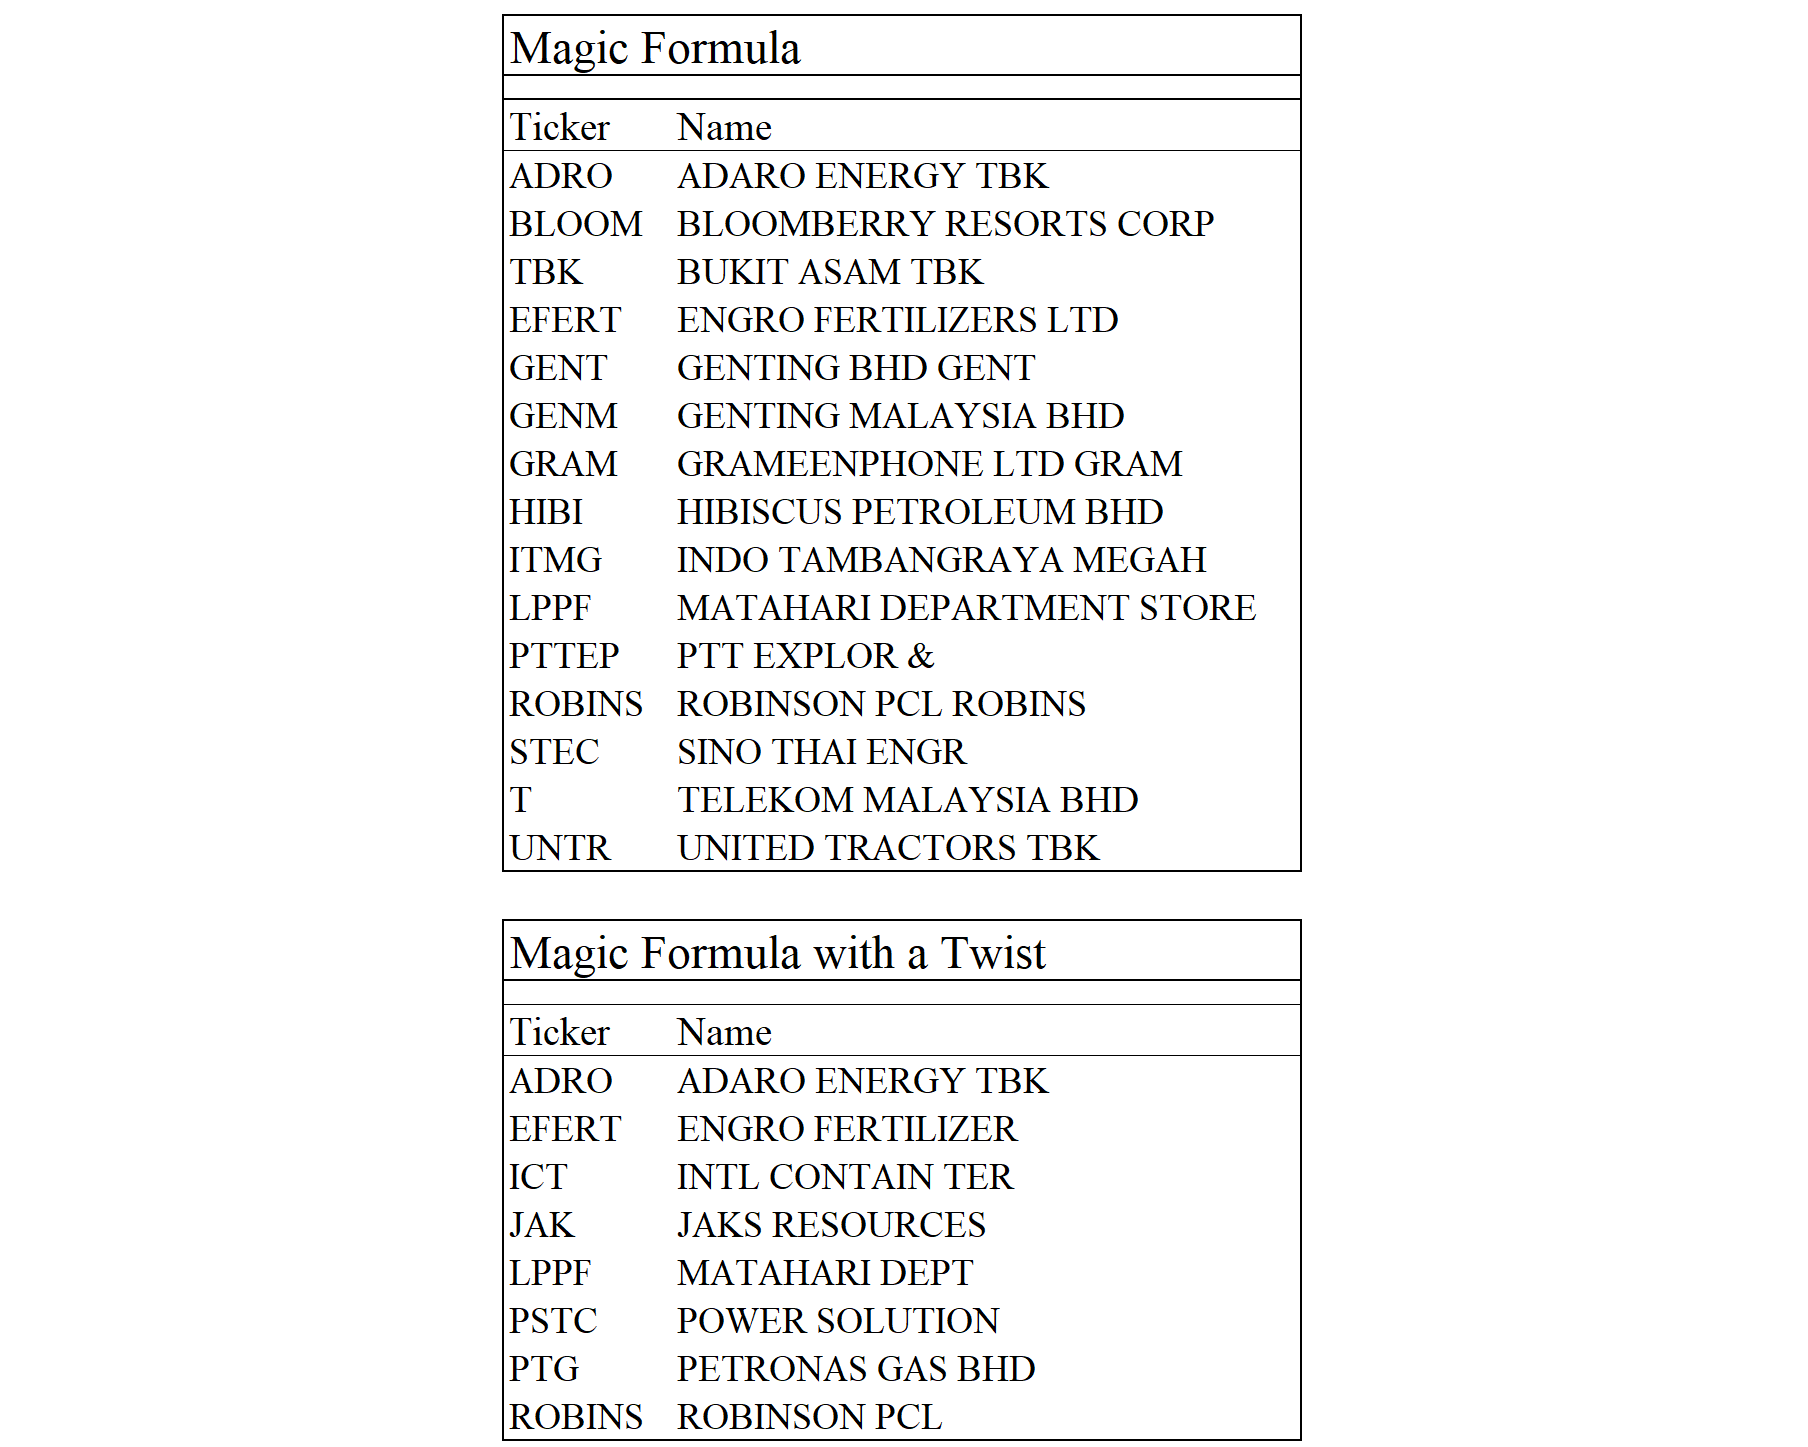
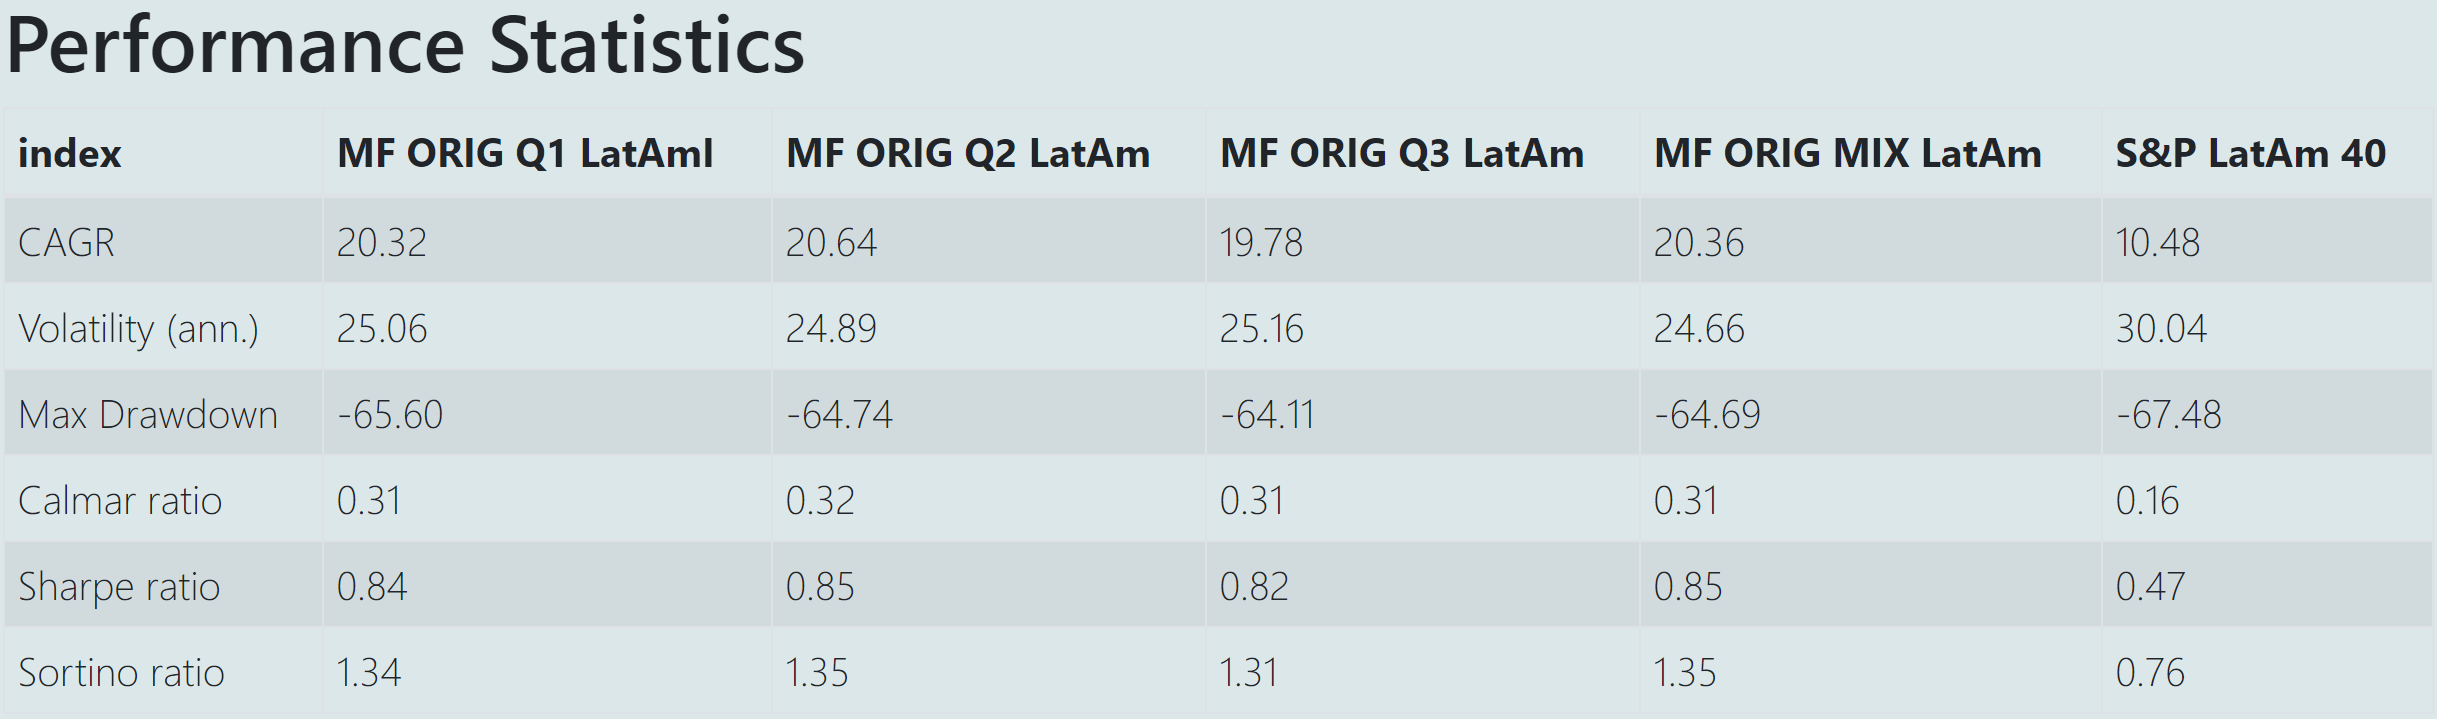
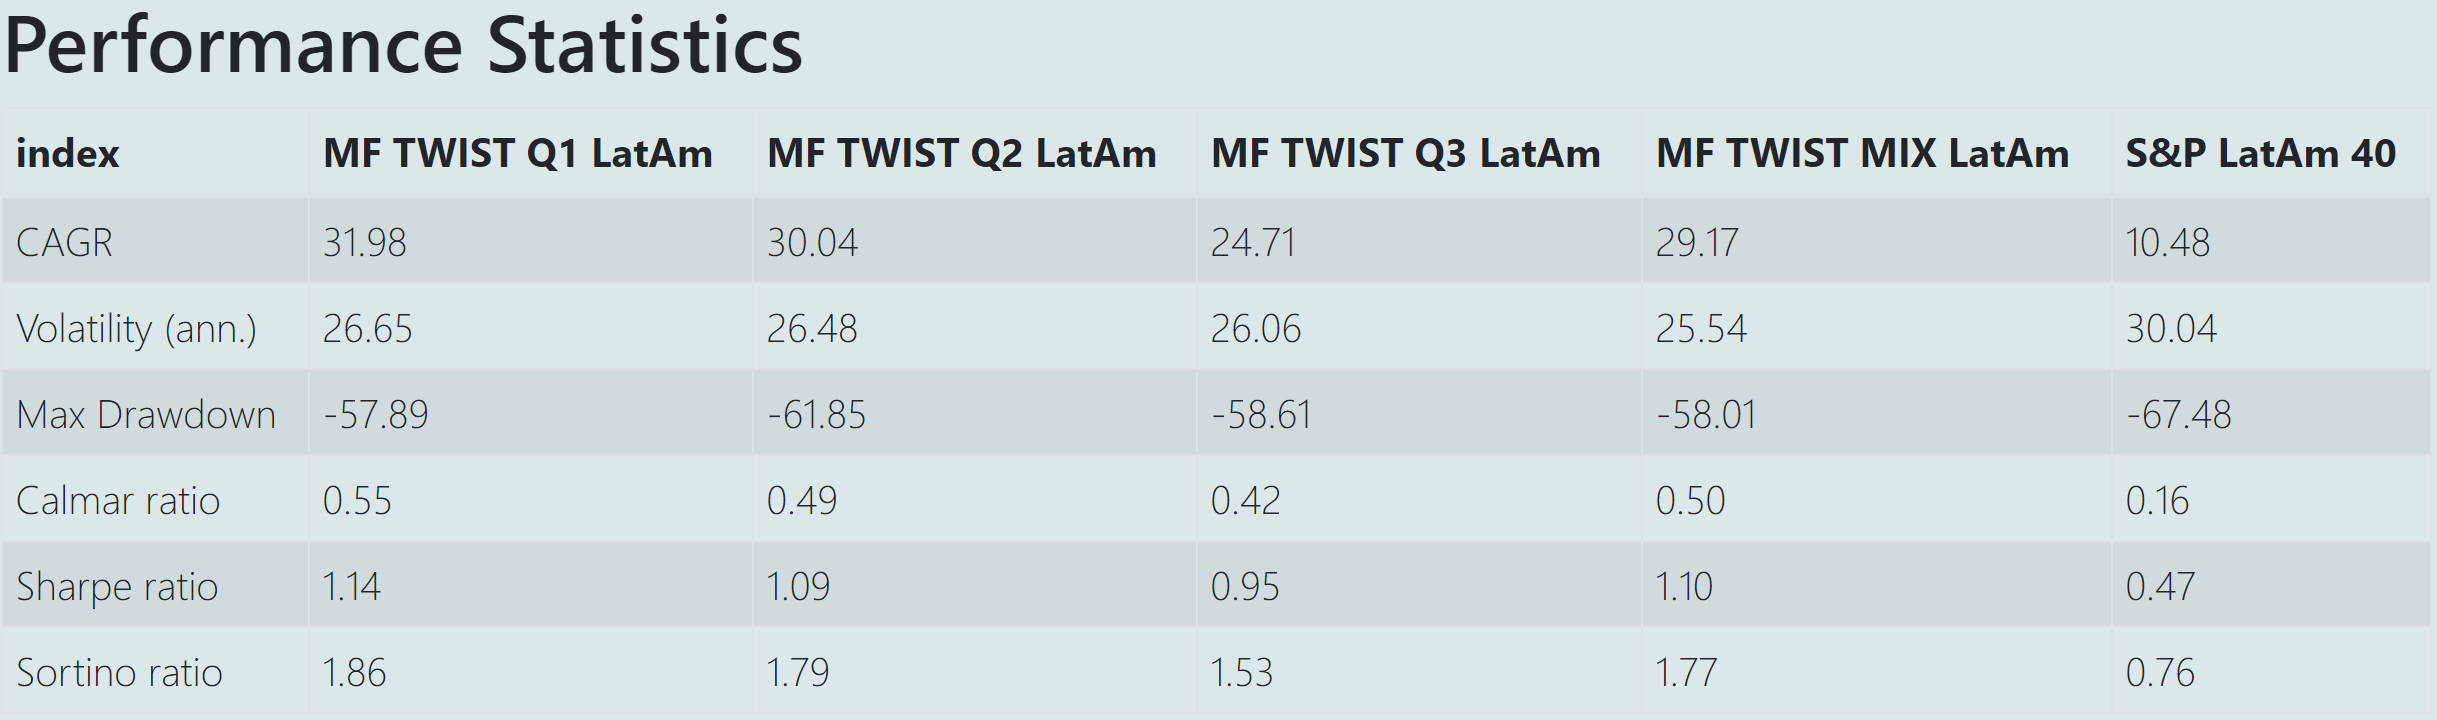
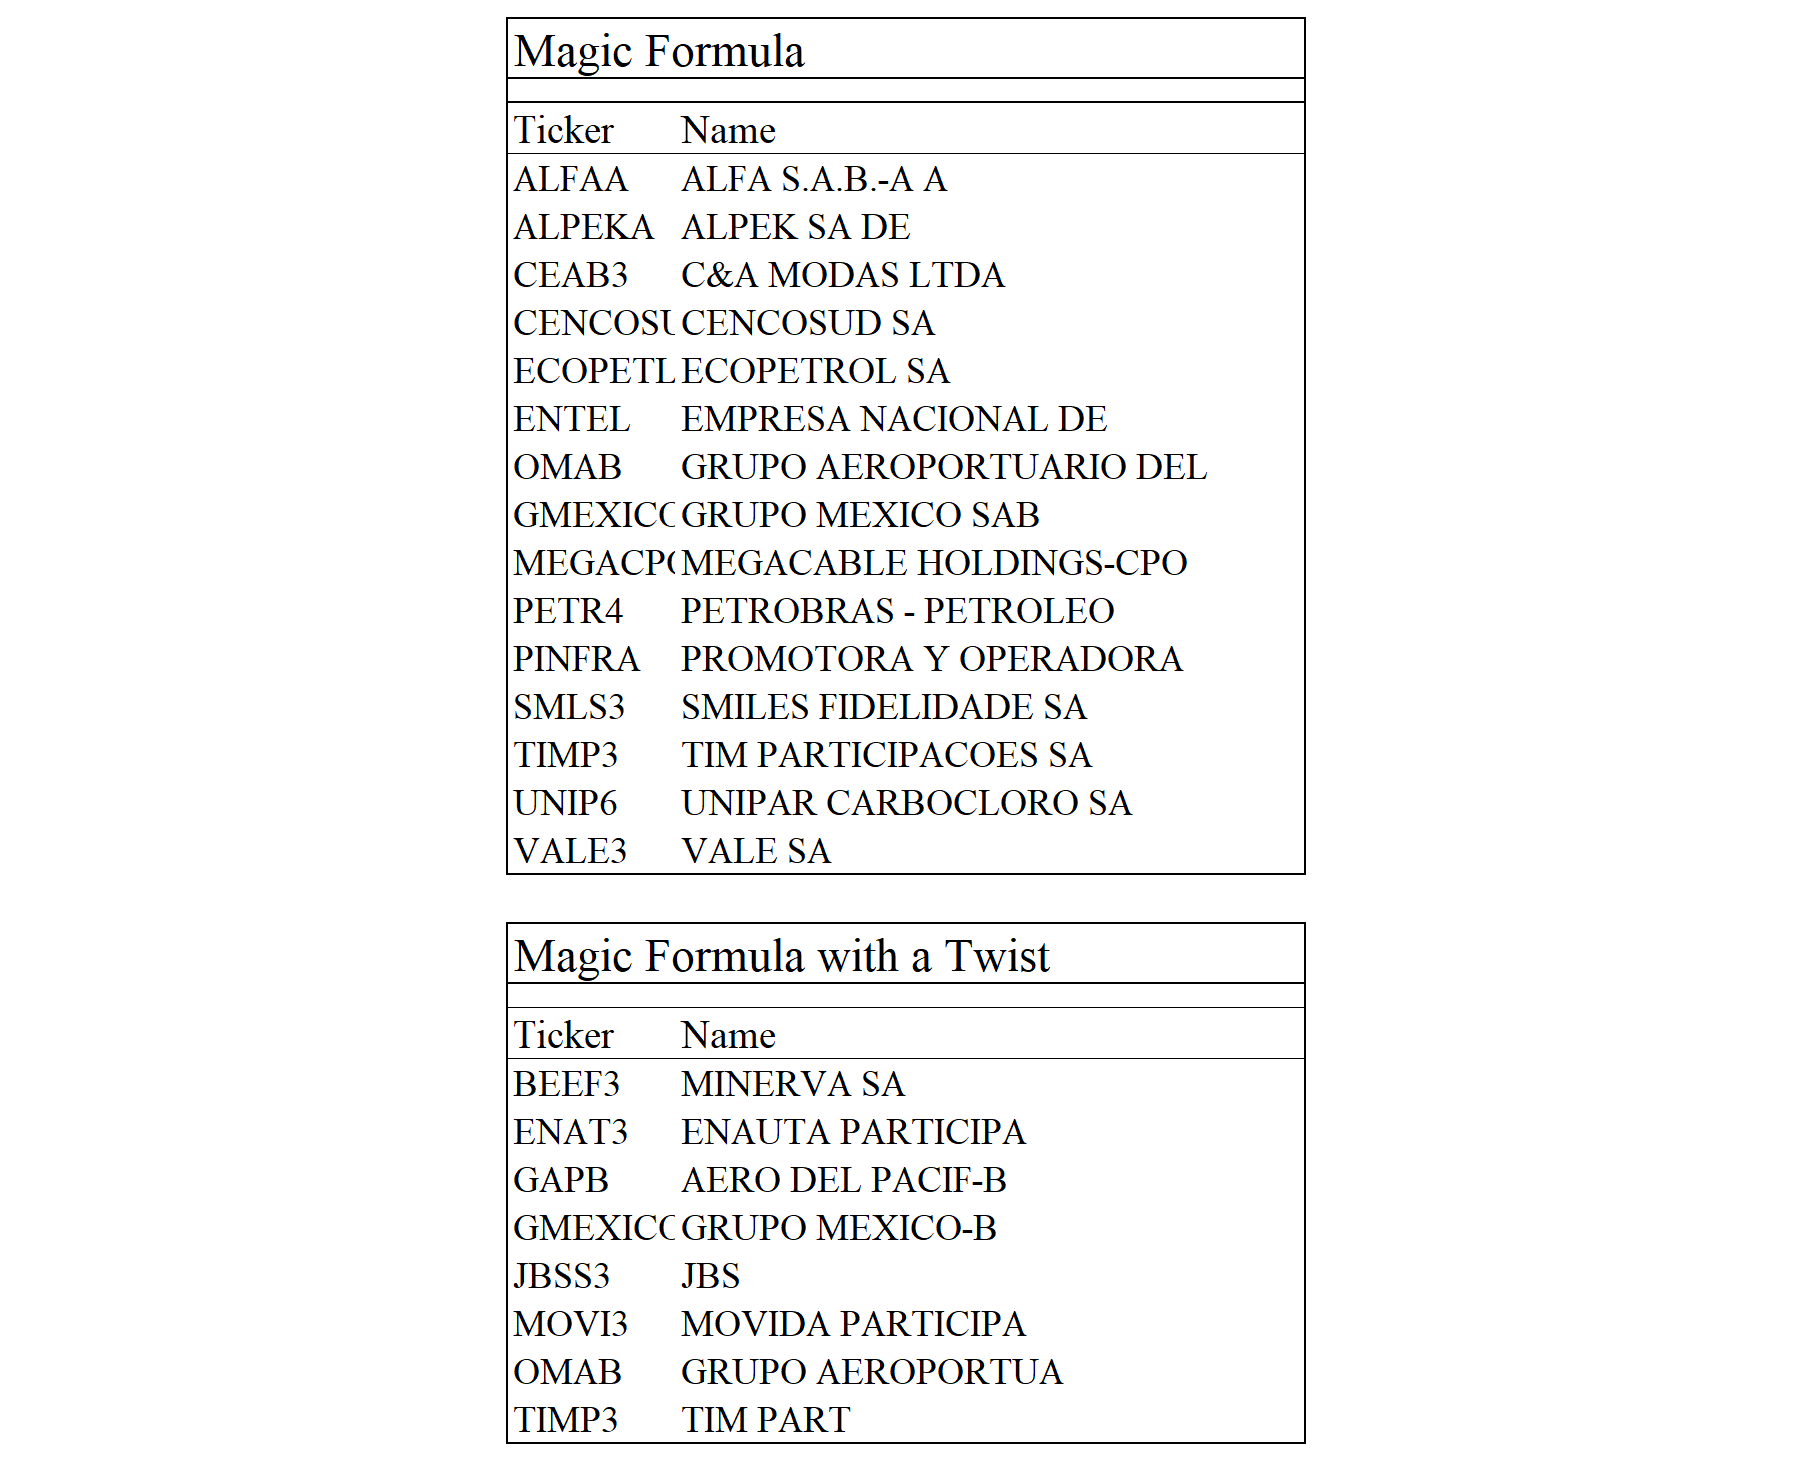
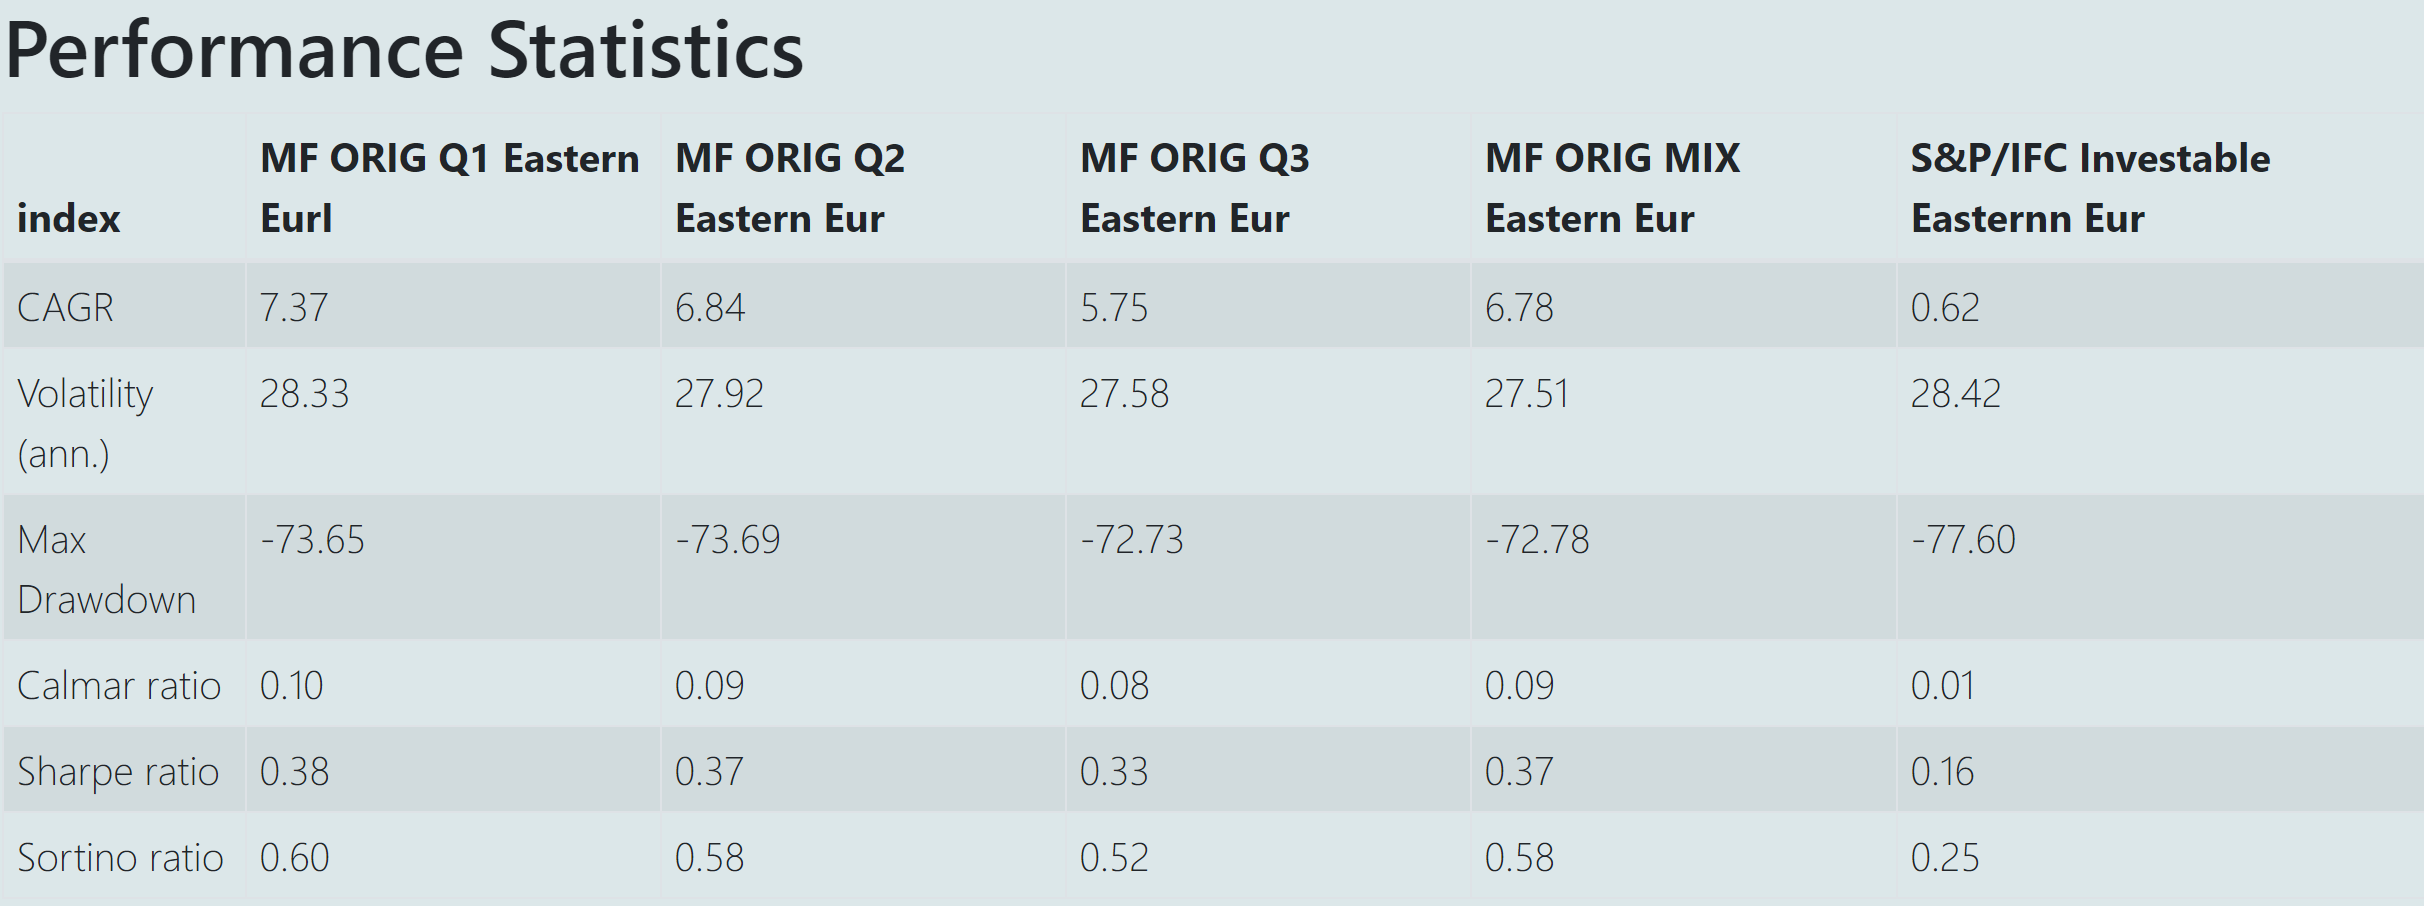
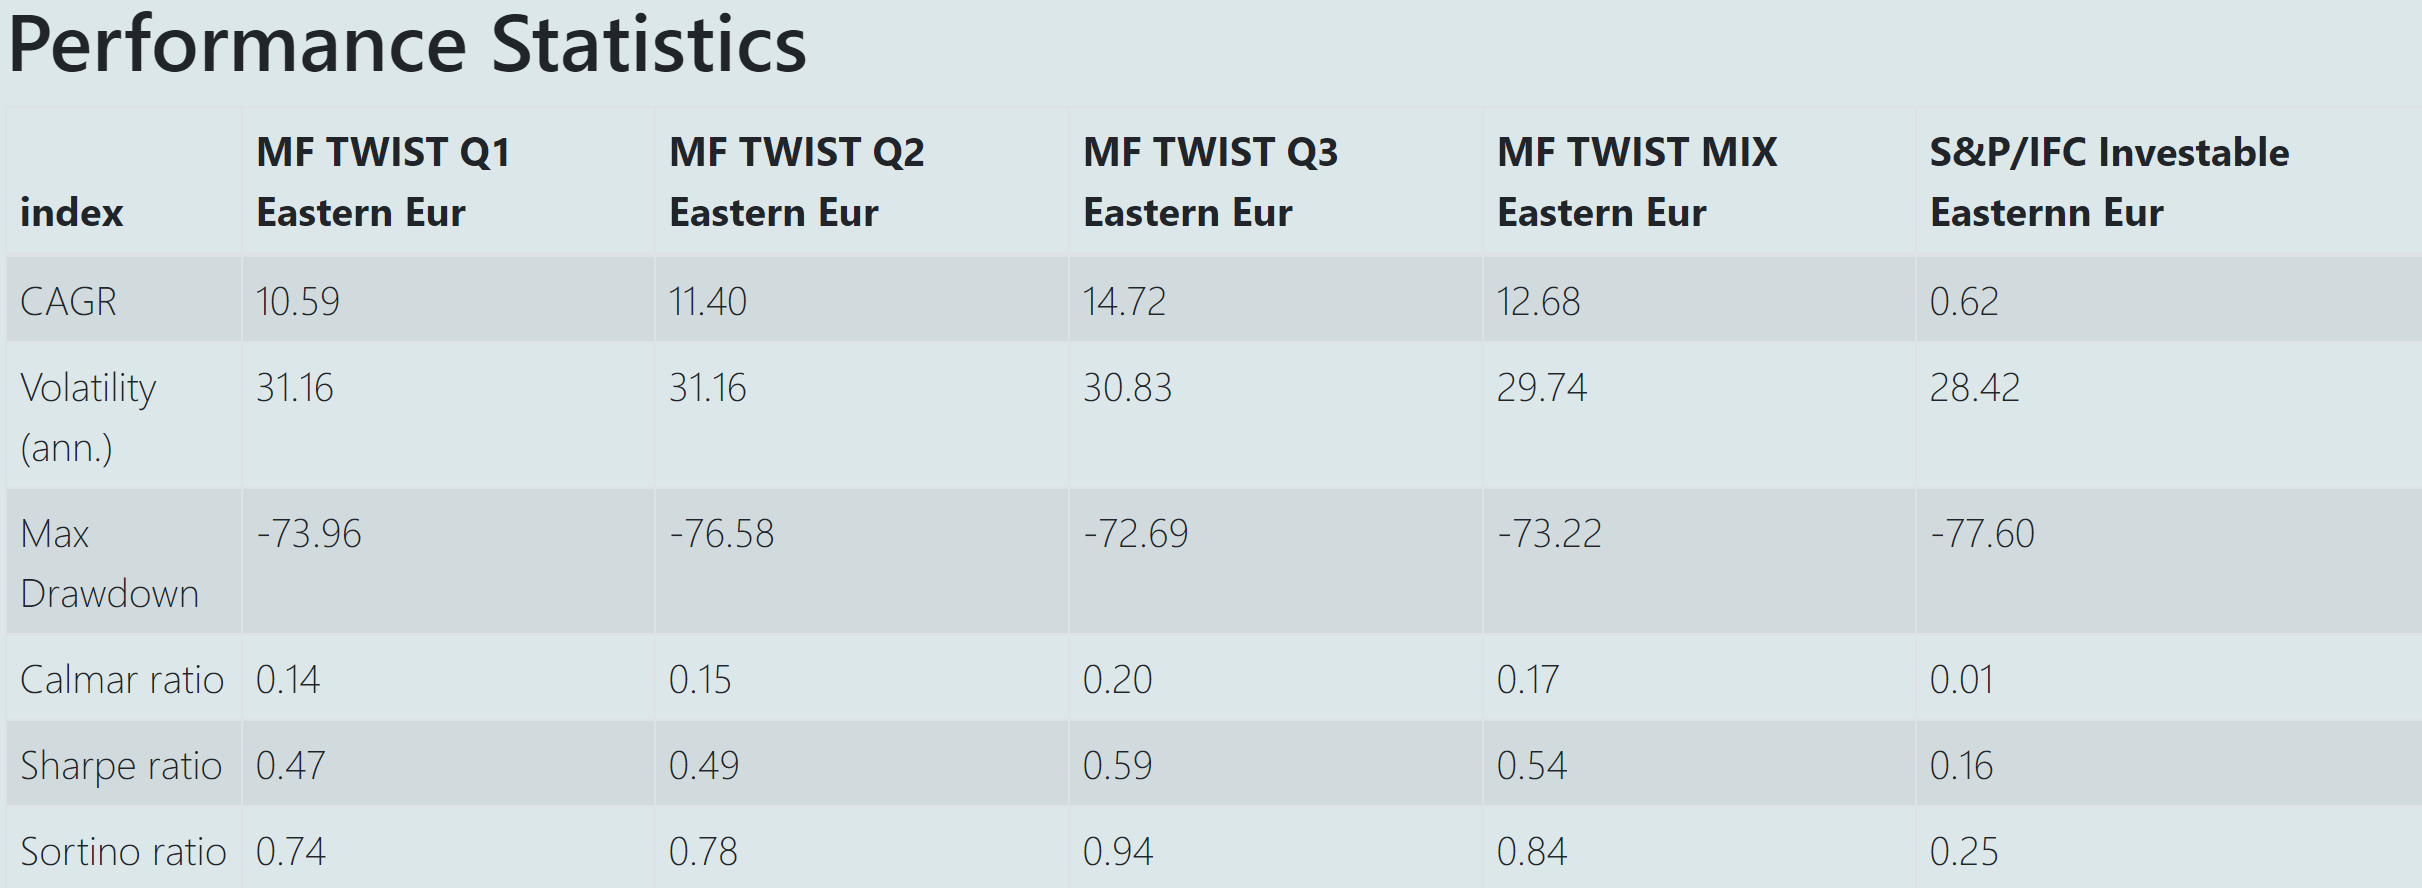
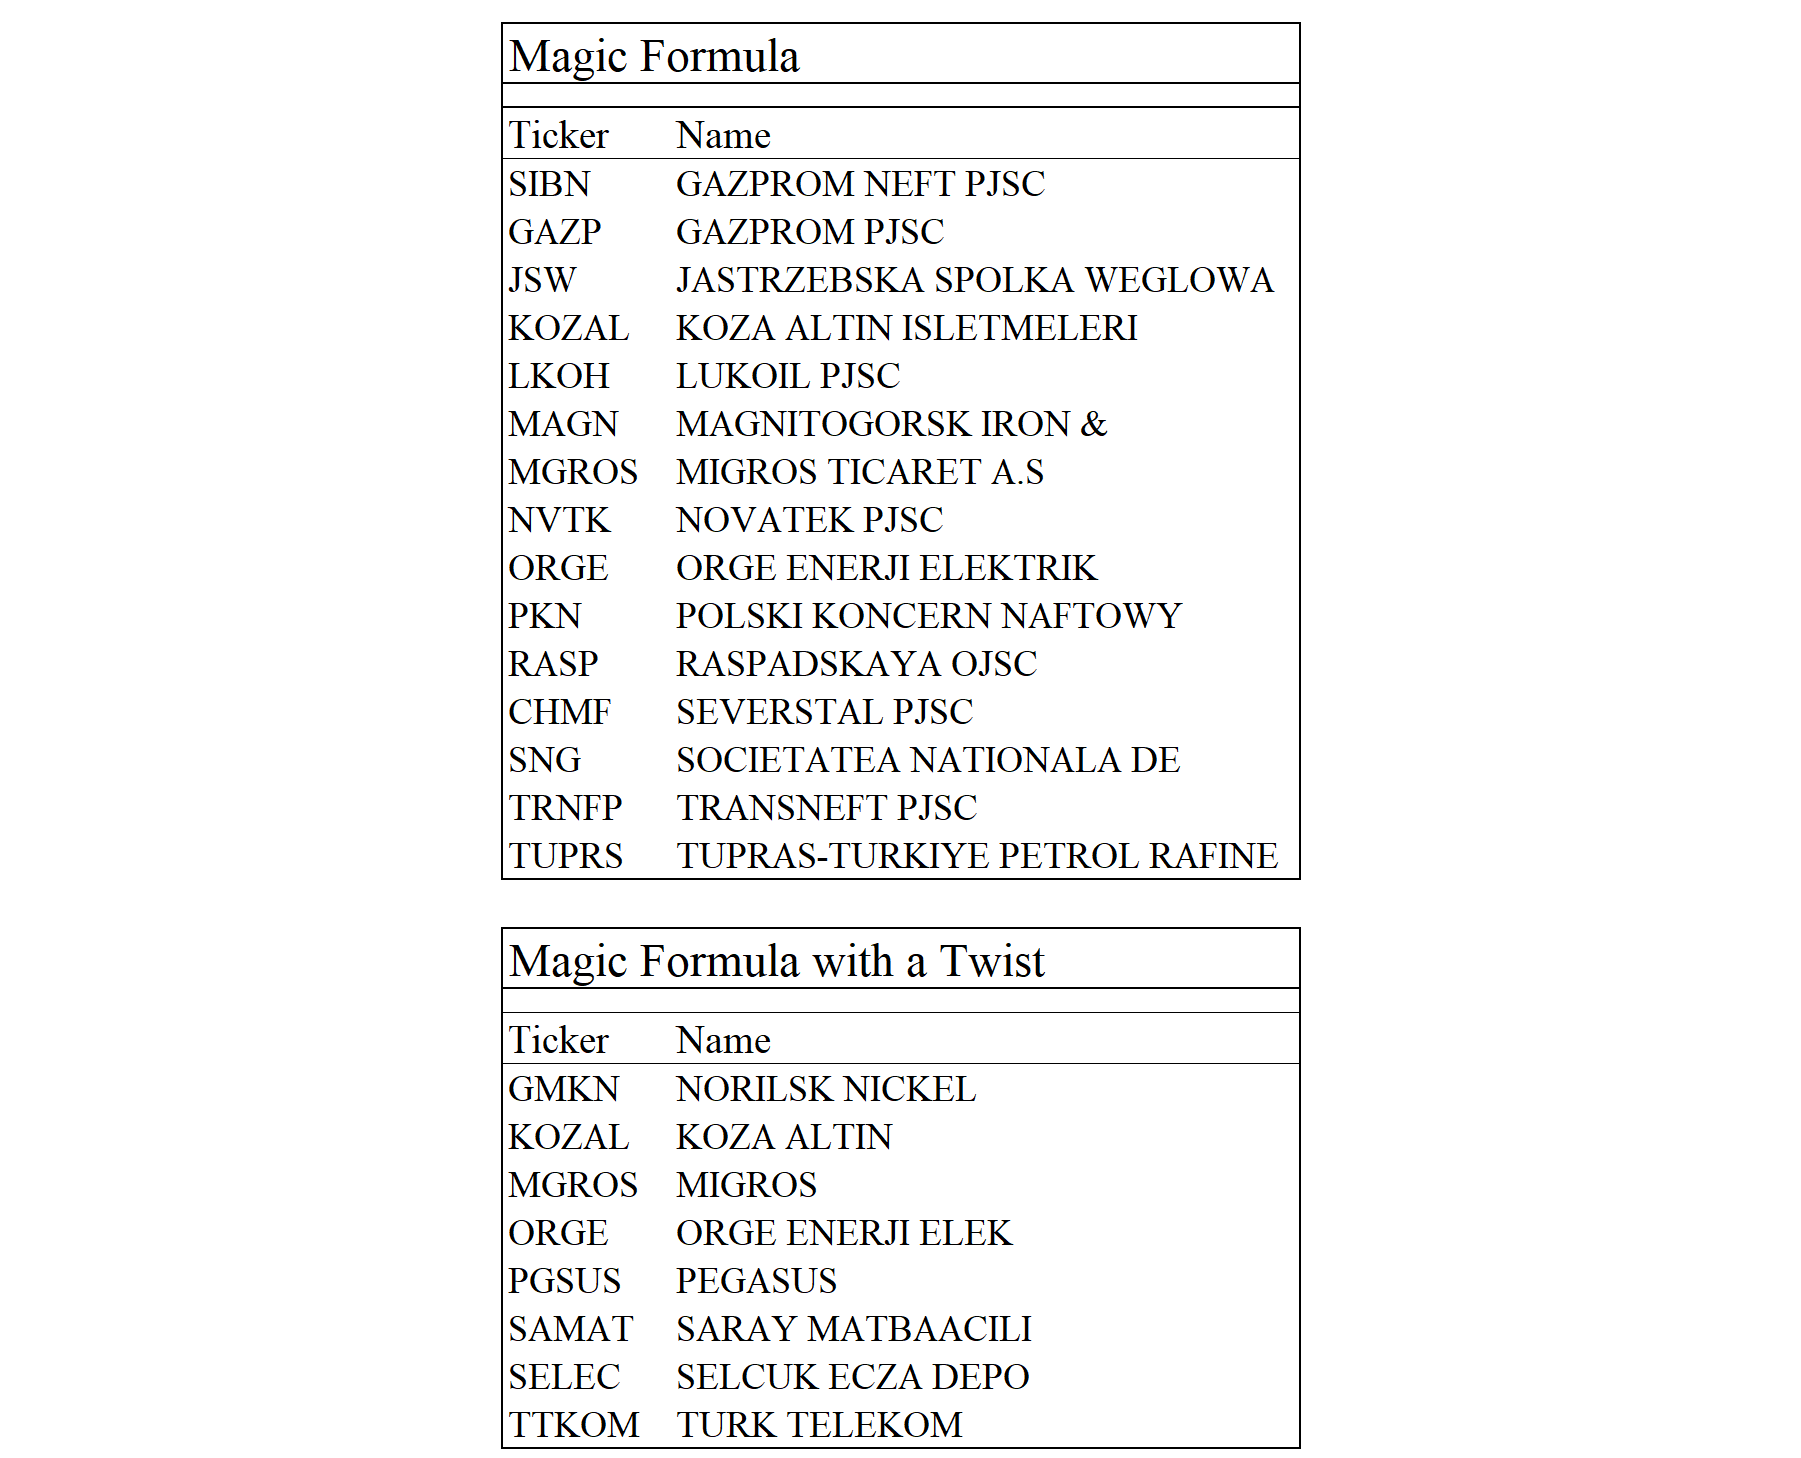
Below, I present the results we get selecting the top 10 (or 15 for some markets) stocks for a variety of indices (to which we add liquidity constraints) using quarterly rebalancing. You will also find the results of a screen combining the "Magic Formula" with another filter (Twist version). The number of stocks selected is depending on the initial universe size (from more than 2000 in the US to slightly more than 100 in Switzerland). The data is from Bloomberg.
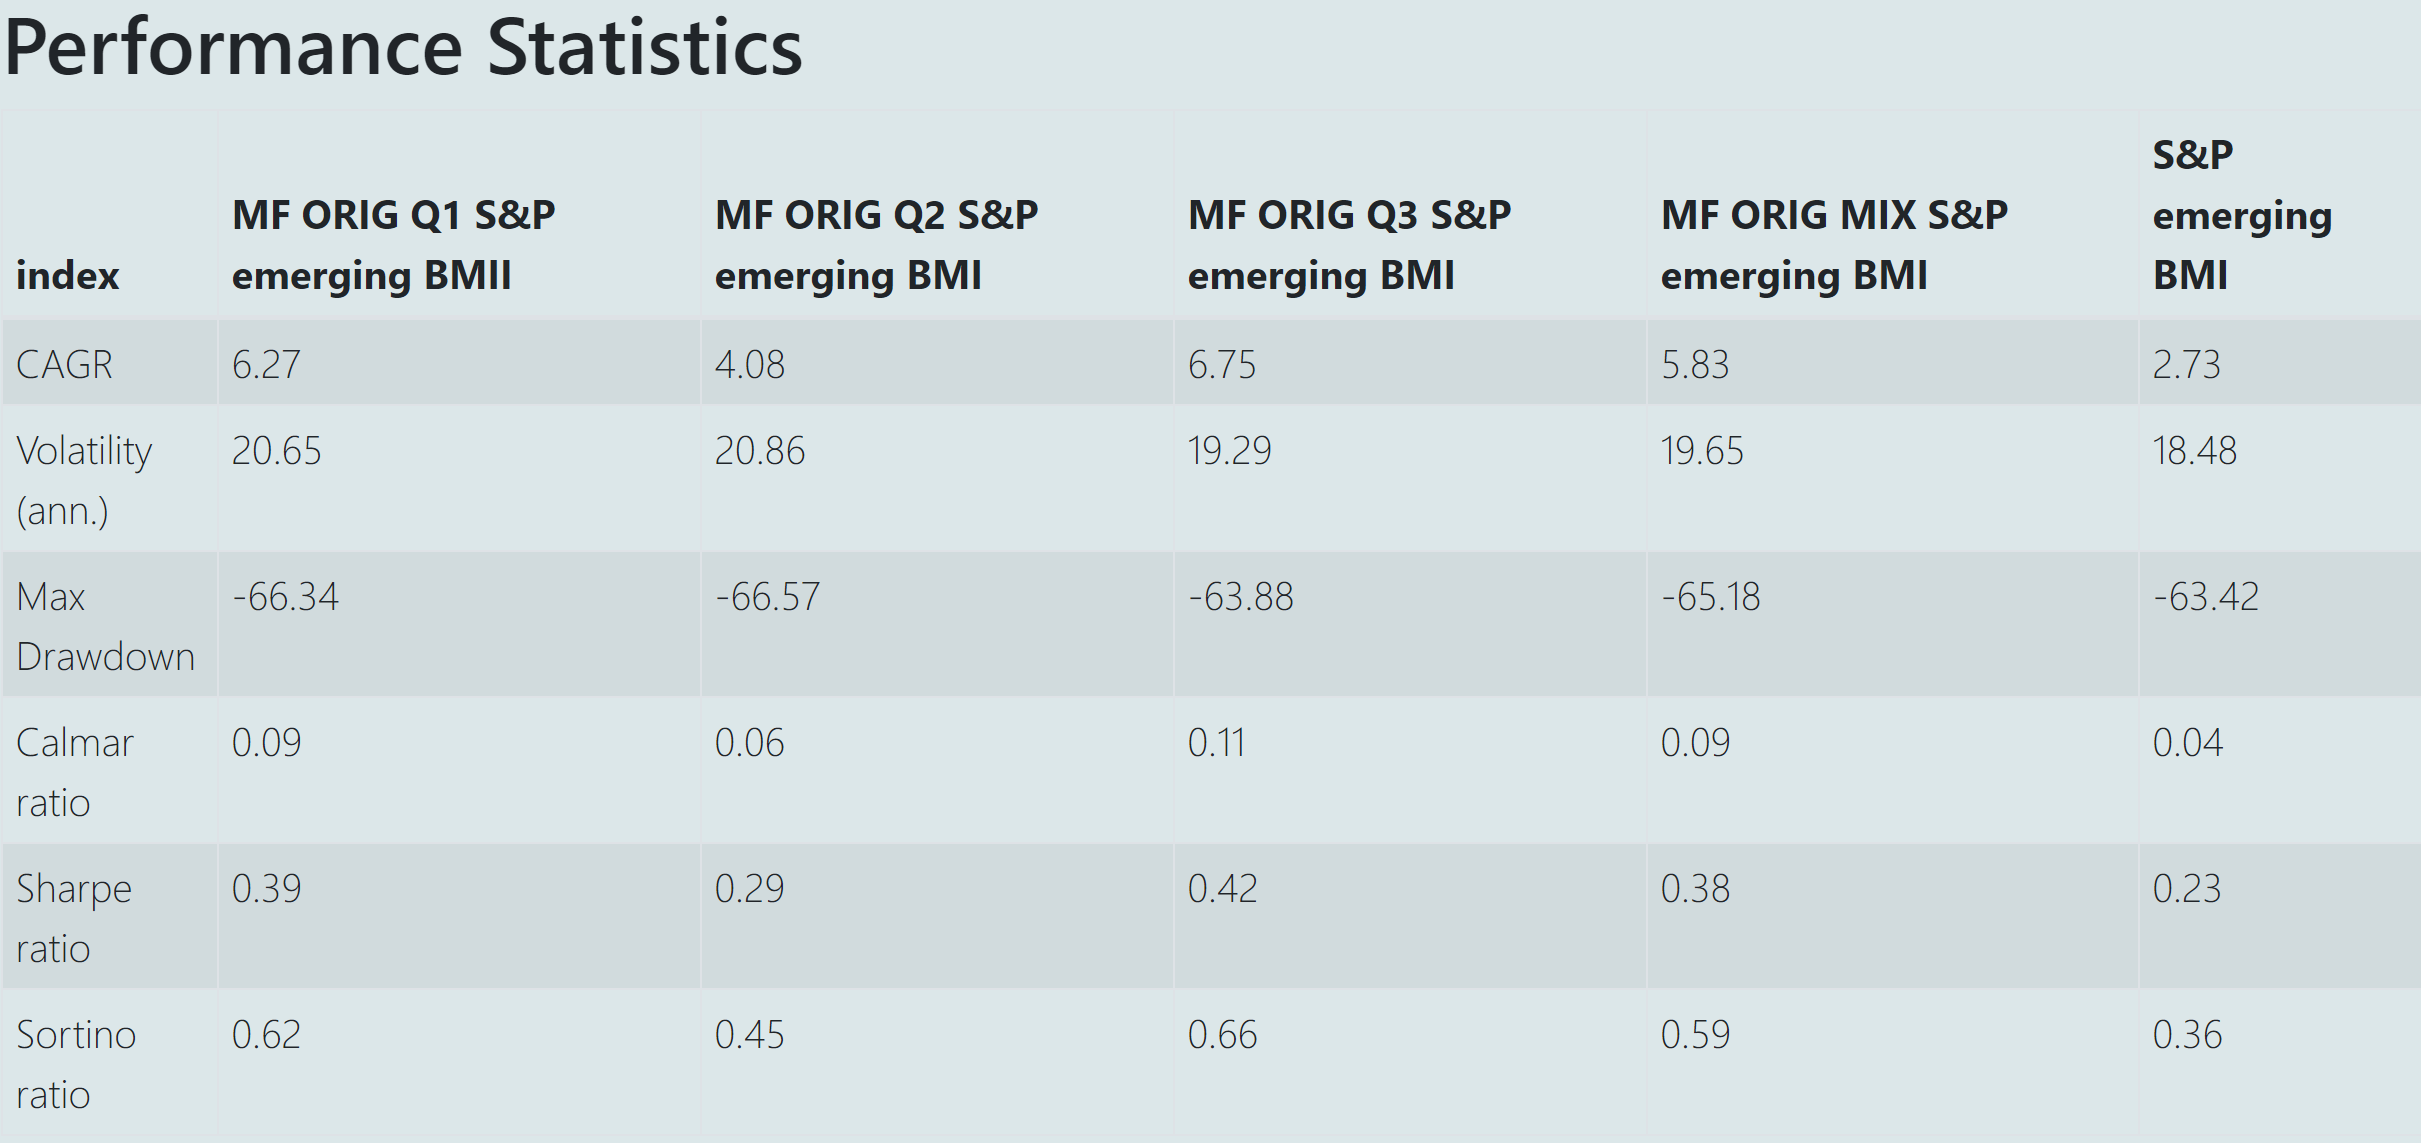
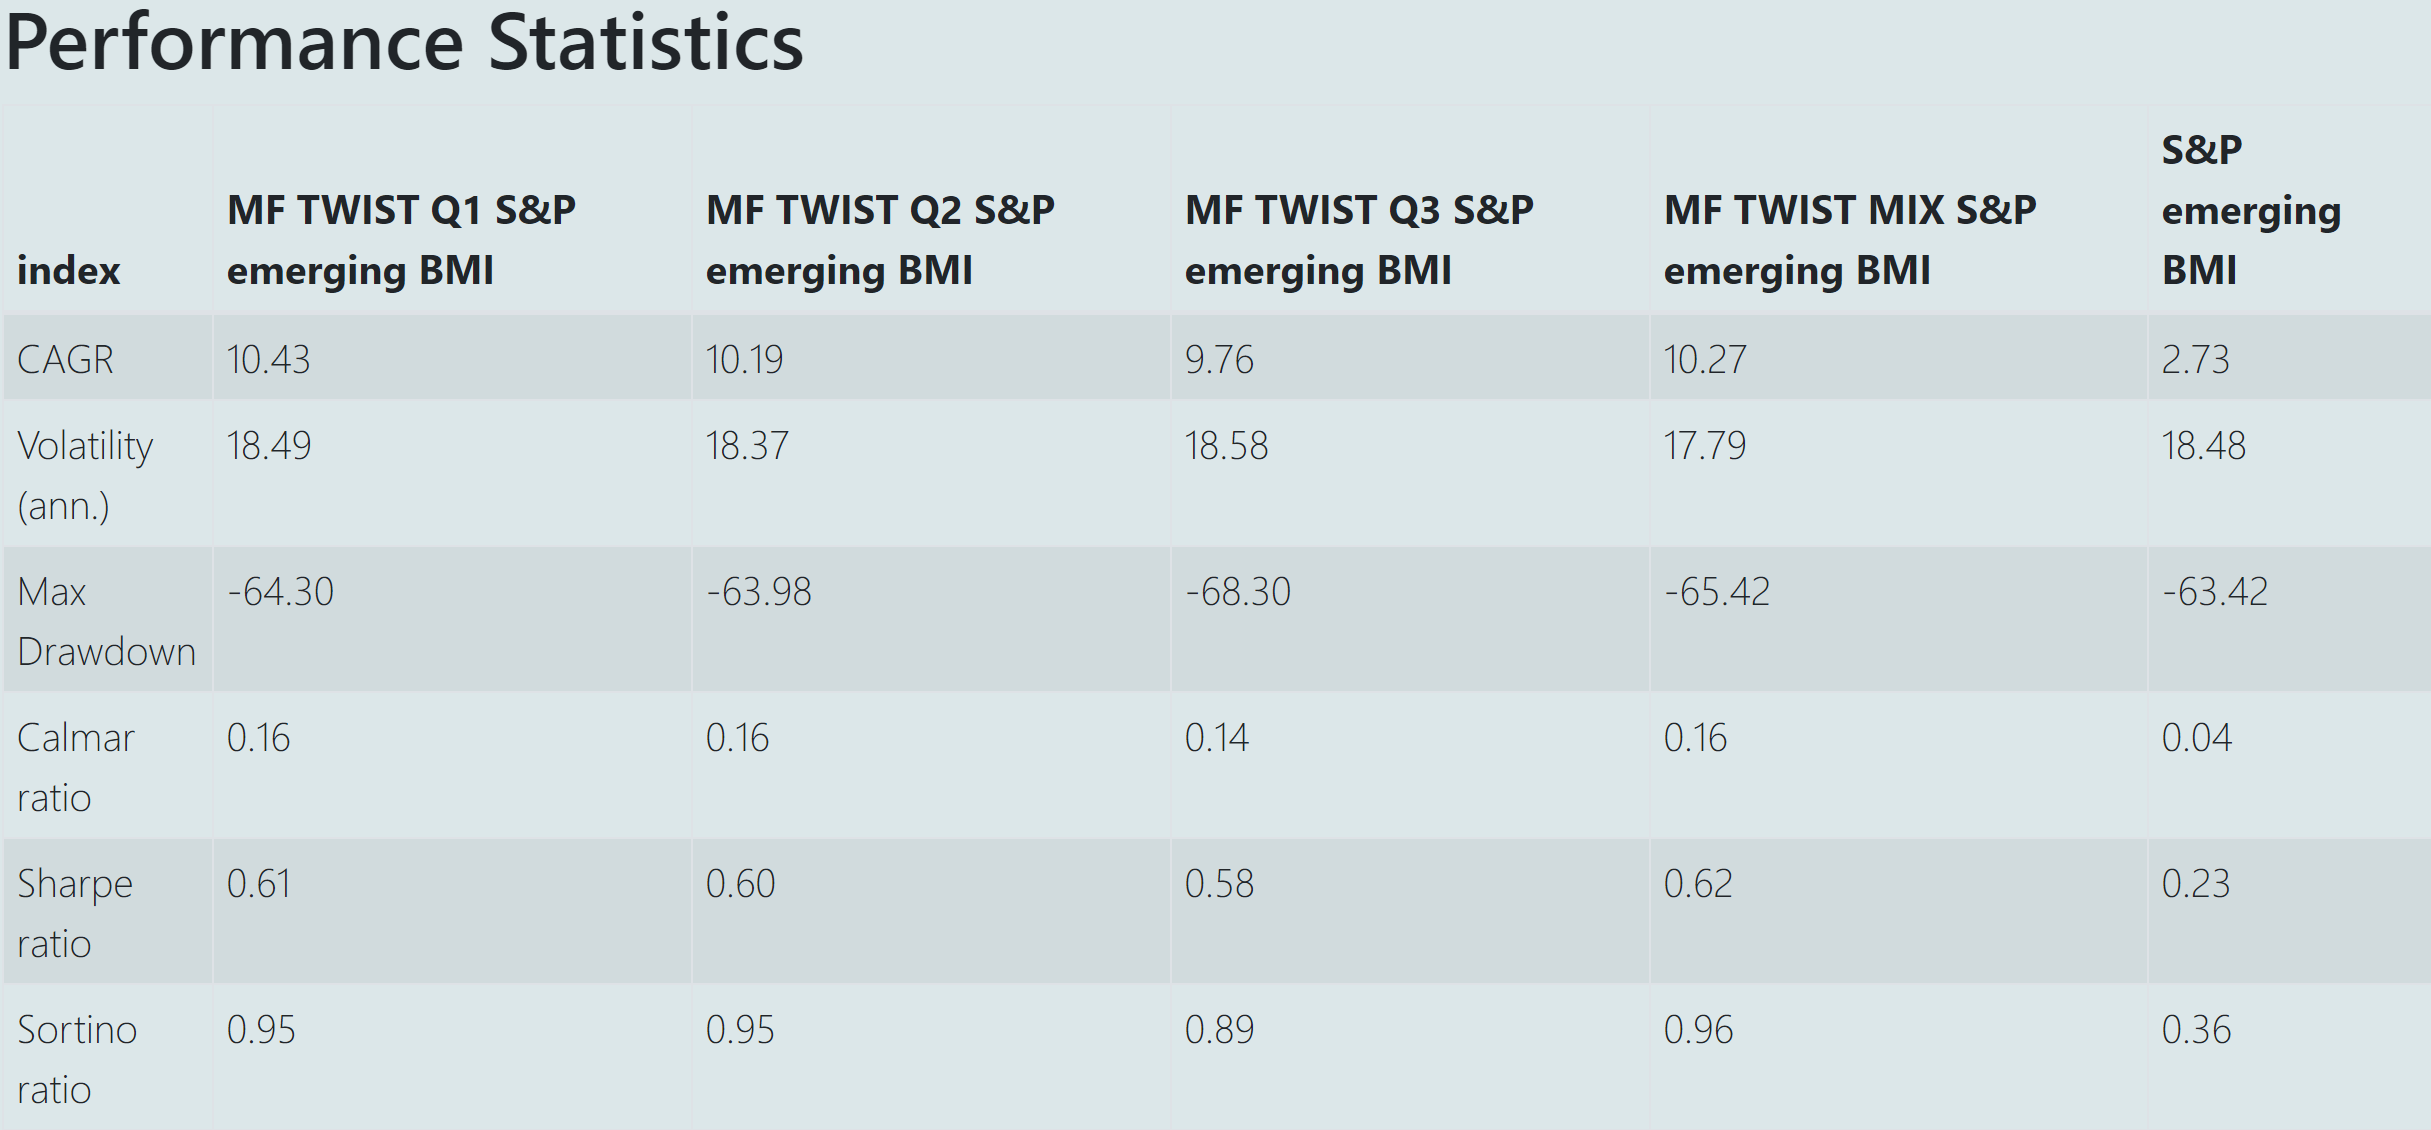
To account for timing luck, I created 3 portfolios that start in a different month (all are rebalanced quarterly). I call them Q1, Q2 and Q3. You will see that there can be sizable differences depending on the starting date. This is why I recommend investing in staggered portfolios with different starting date (one should try to be lucky in the casinos not while investing). This is what I call the "Mix" strategies, which invest 1/3 to each of the Q1, Q2 and Q3 portfolios.
Both screens outperform every indices, spanning most regions of the world, sometimes by double digit numbers. I am even getting close to the 30% annual performance described in Greenblatt's book with our Latin American Twist version.
On a side note, I believe that Joel Greenblatt left some important elements out of the enterprise value for simplicity and/or lack of sufficient historical data. I would advice to include them. Think about pension fund deficit for example...
Note that those two screens are among the 30 I use to create our enhanced indices and to filter the Sentinel universe to its final constituents.
Footsie All-Shares
Original

With a Twist

Stoxx Europe 600
Original

With a Twist

S&P500
Original

With a Twist

Topix
Original

With a Twist

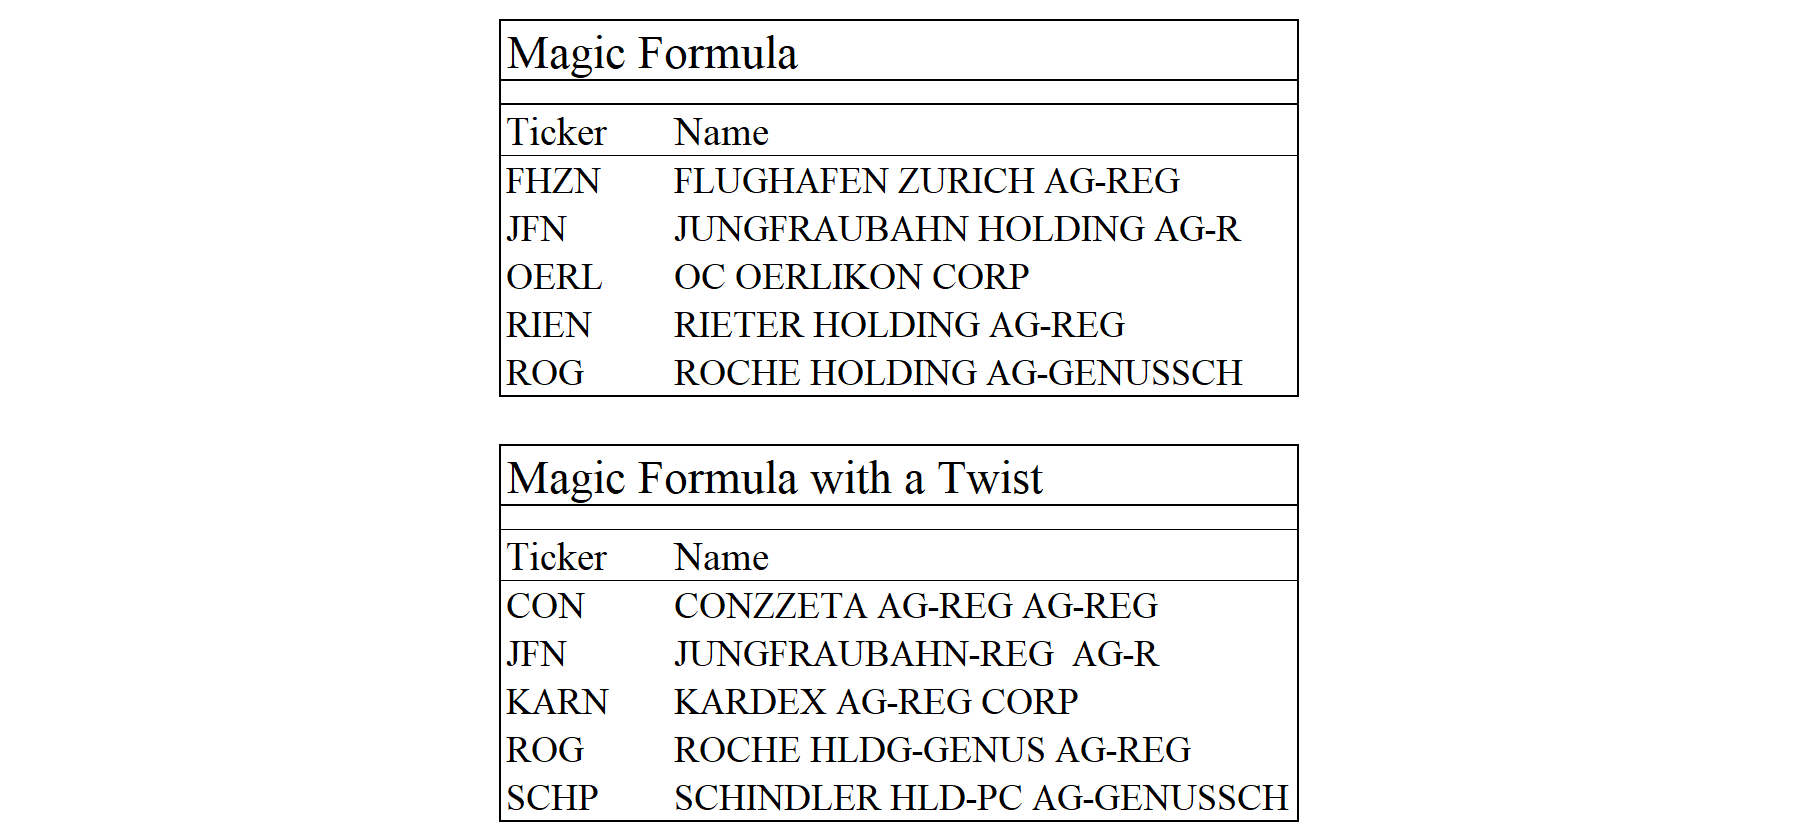
Swiss Performance Index
Original

With a Twist

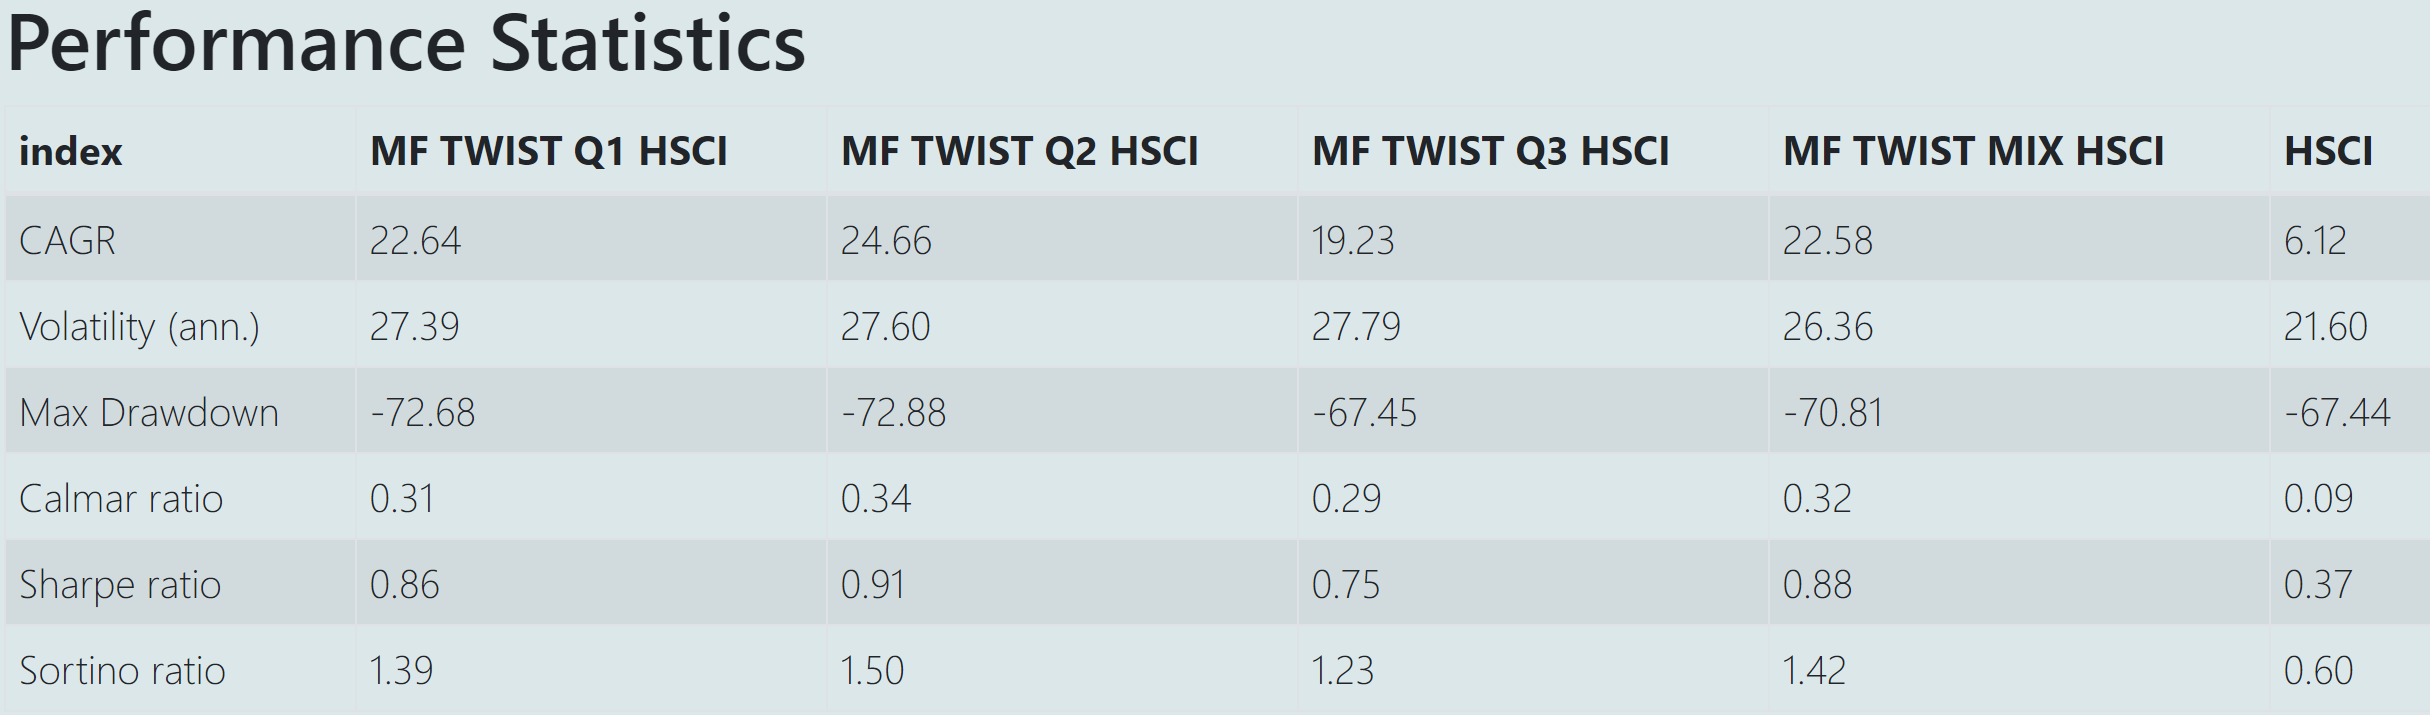
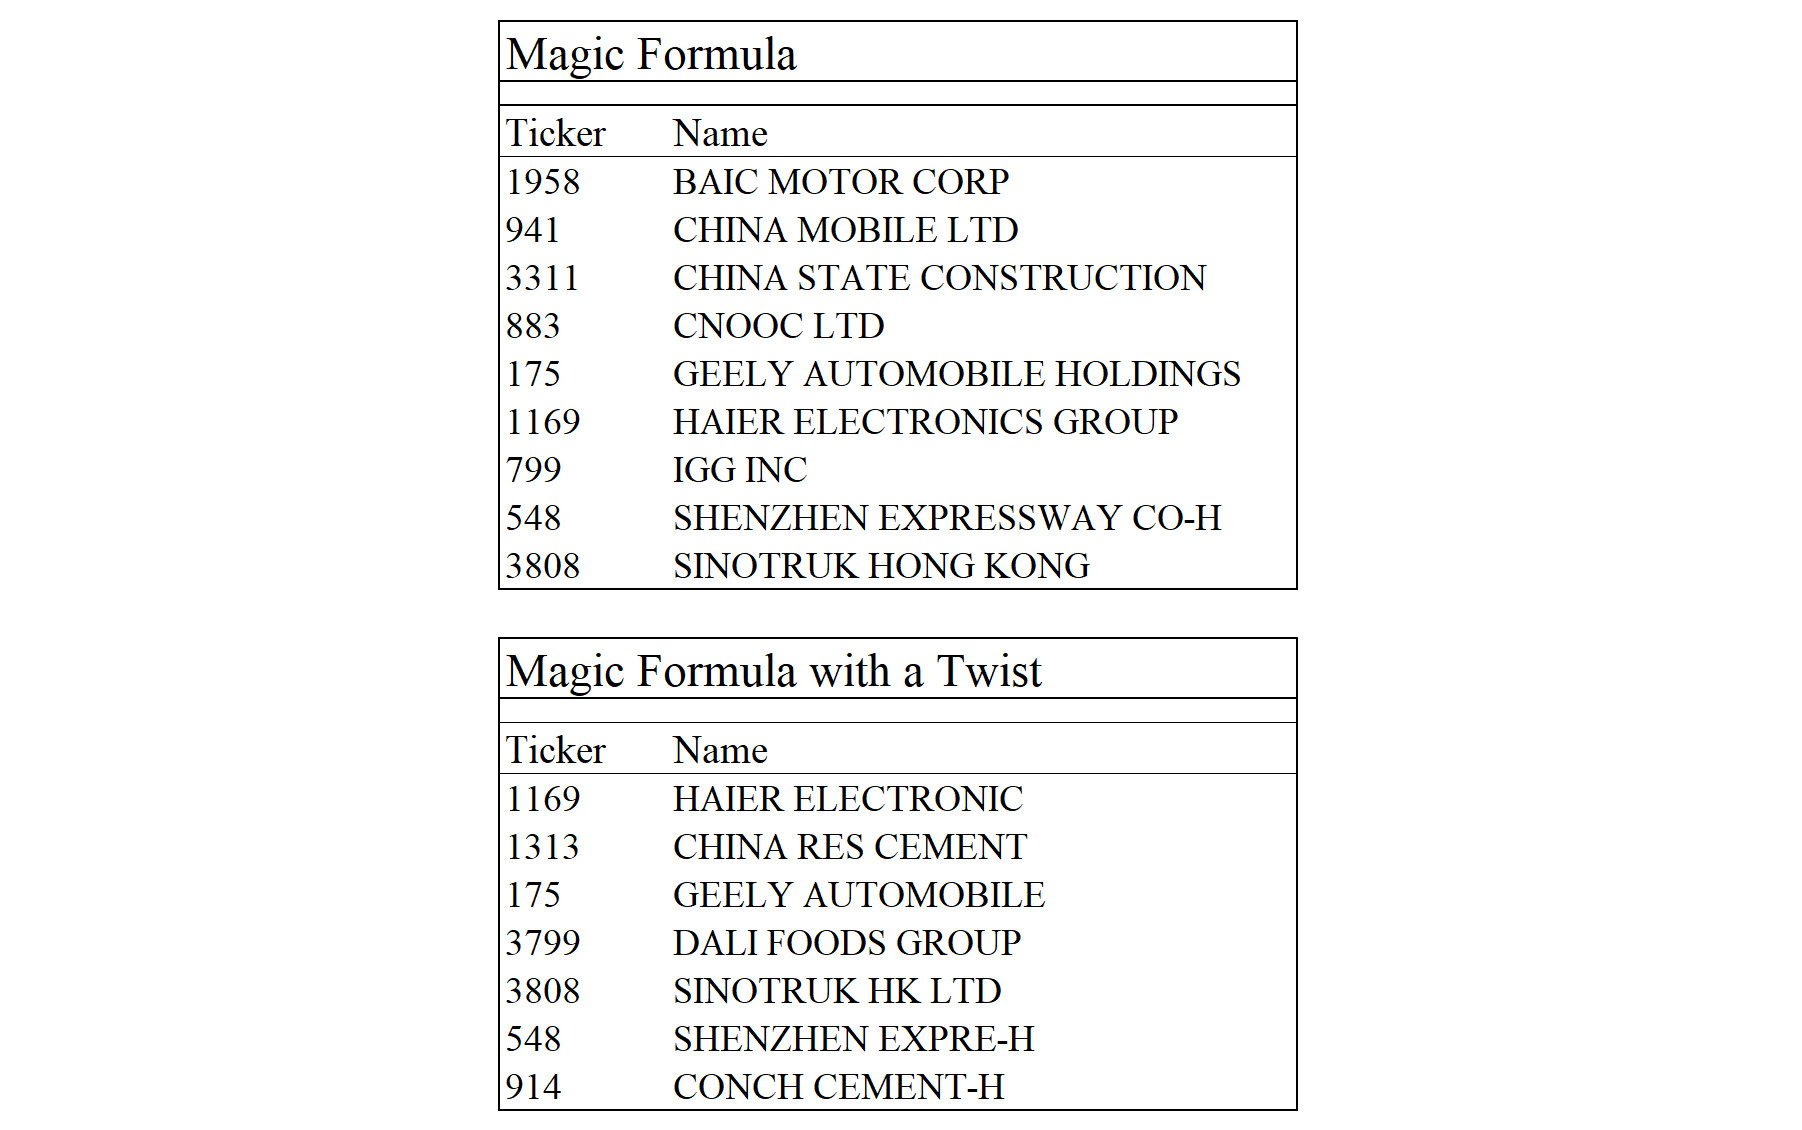
Hang Seng Composite
Original

With a Twist

S&P Global 1200
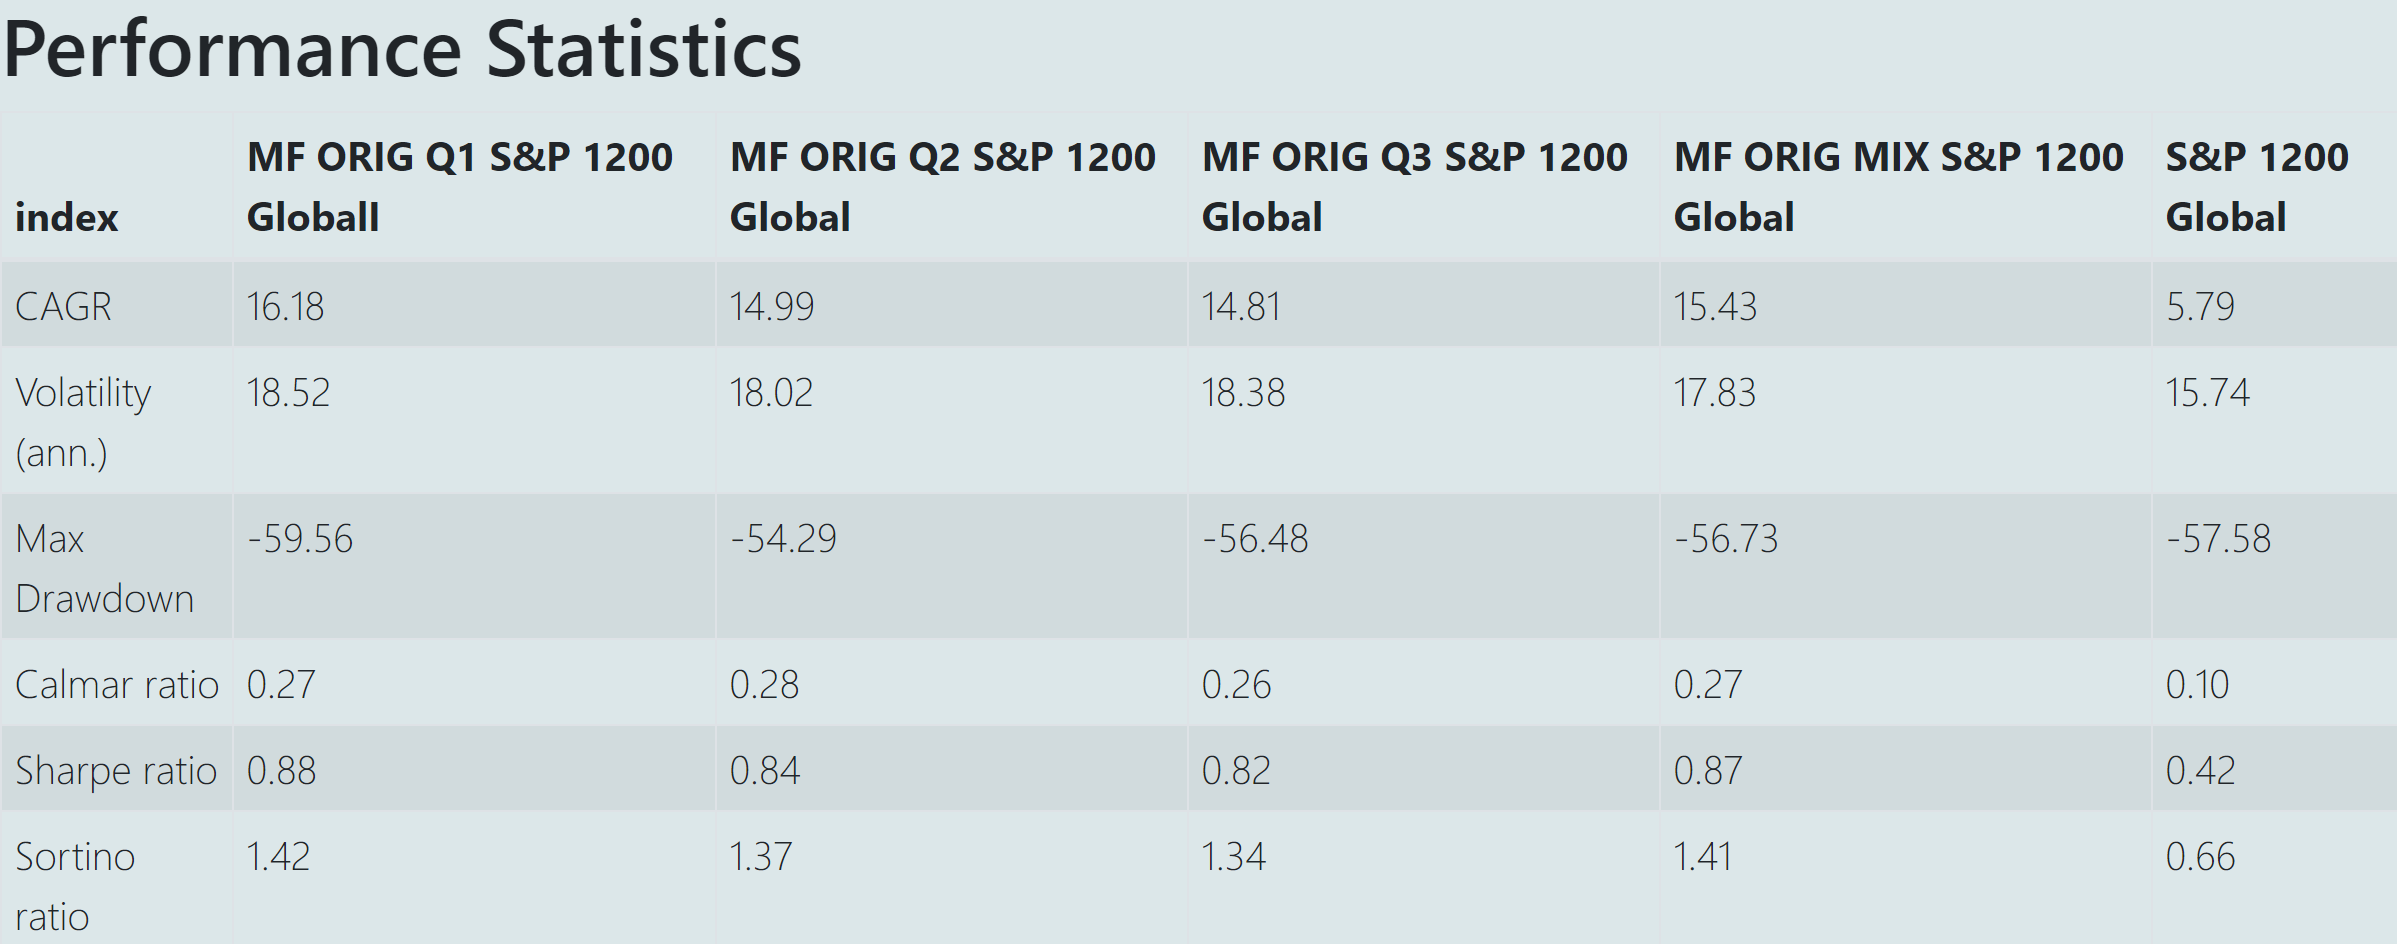
Original

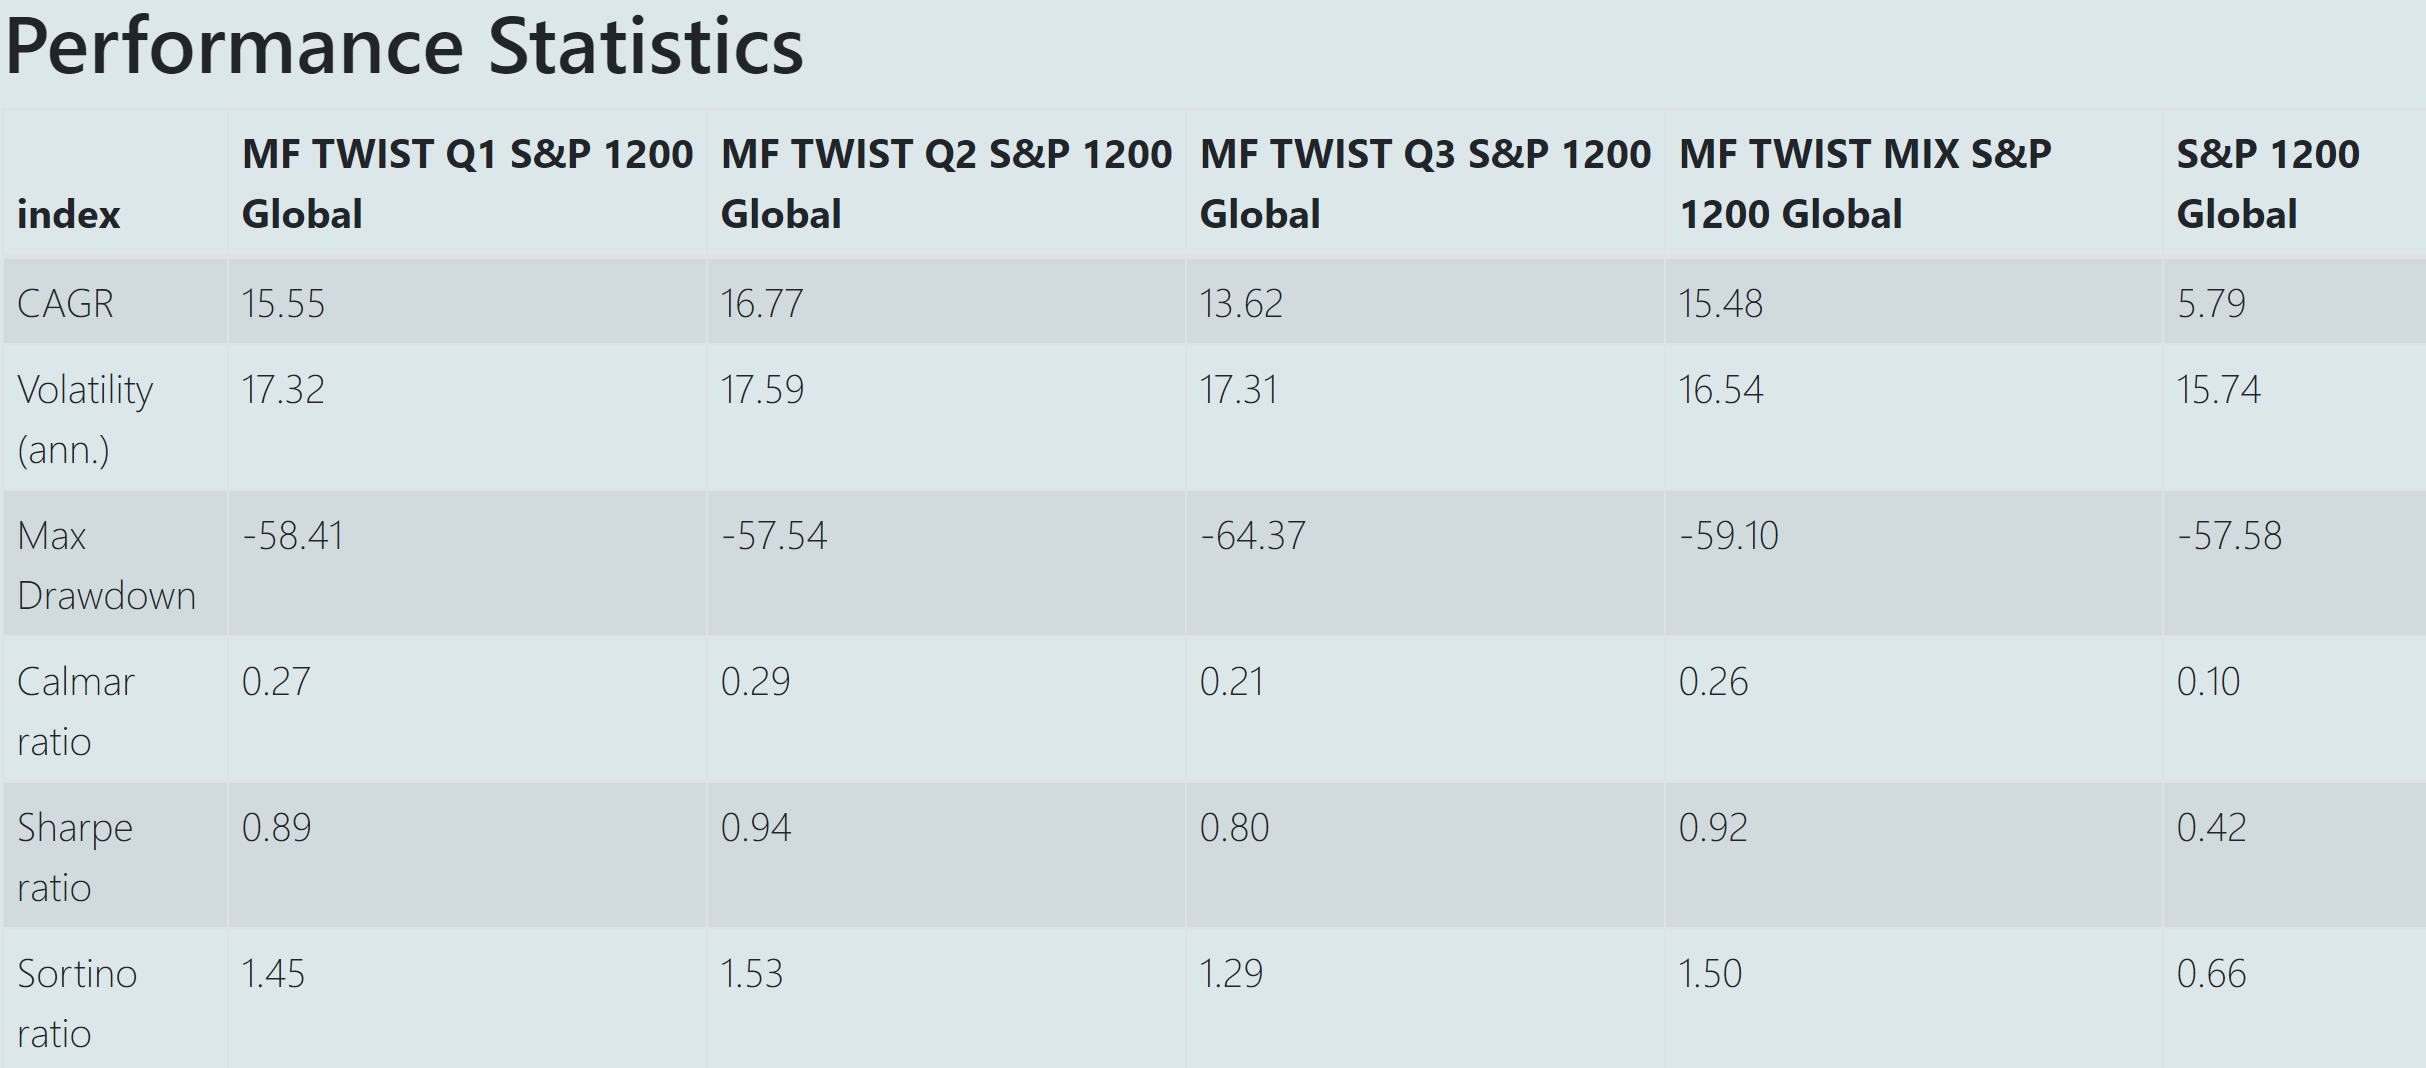
With a Twist

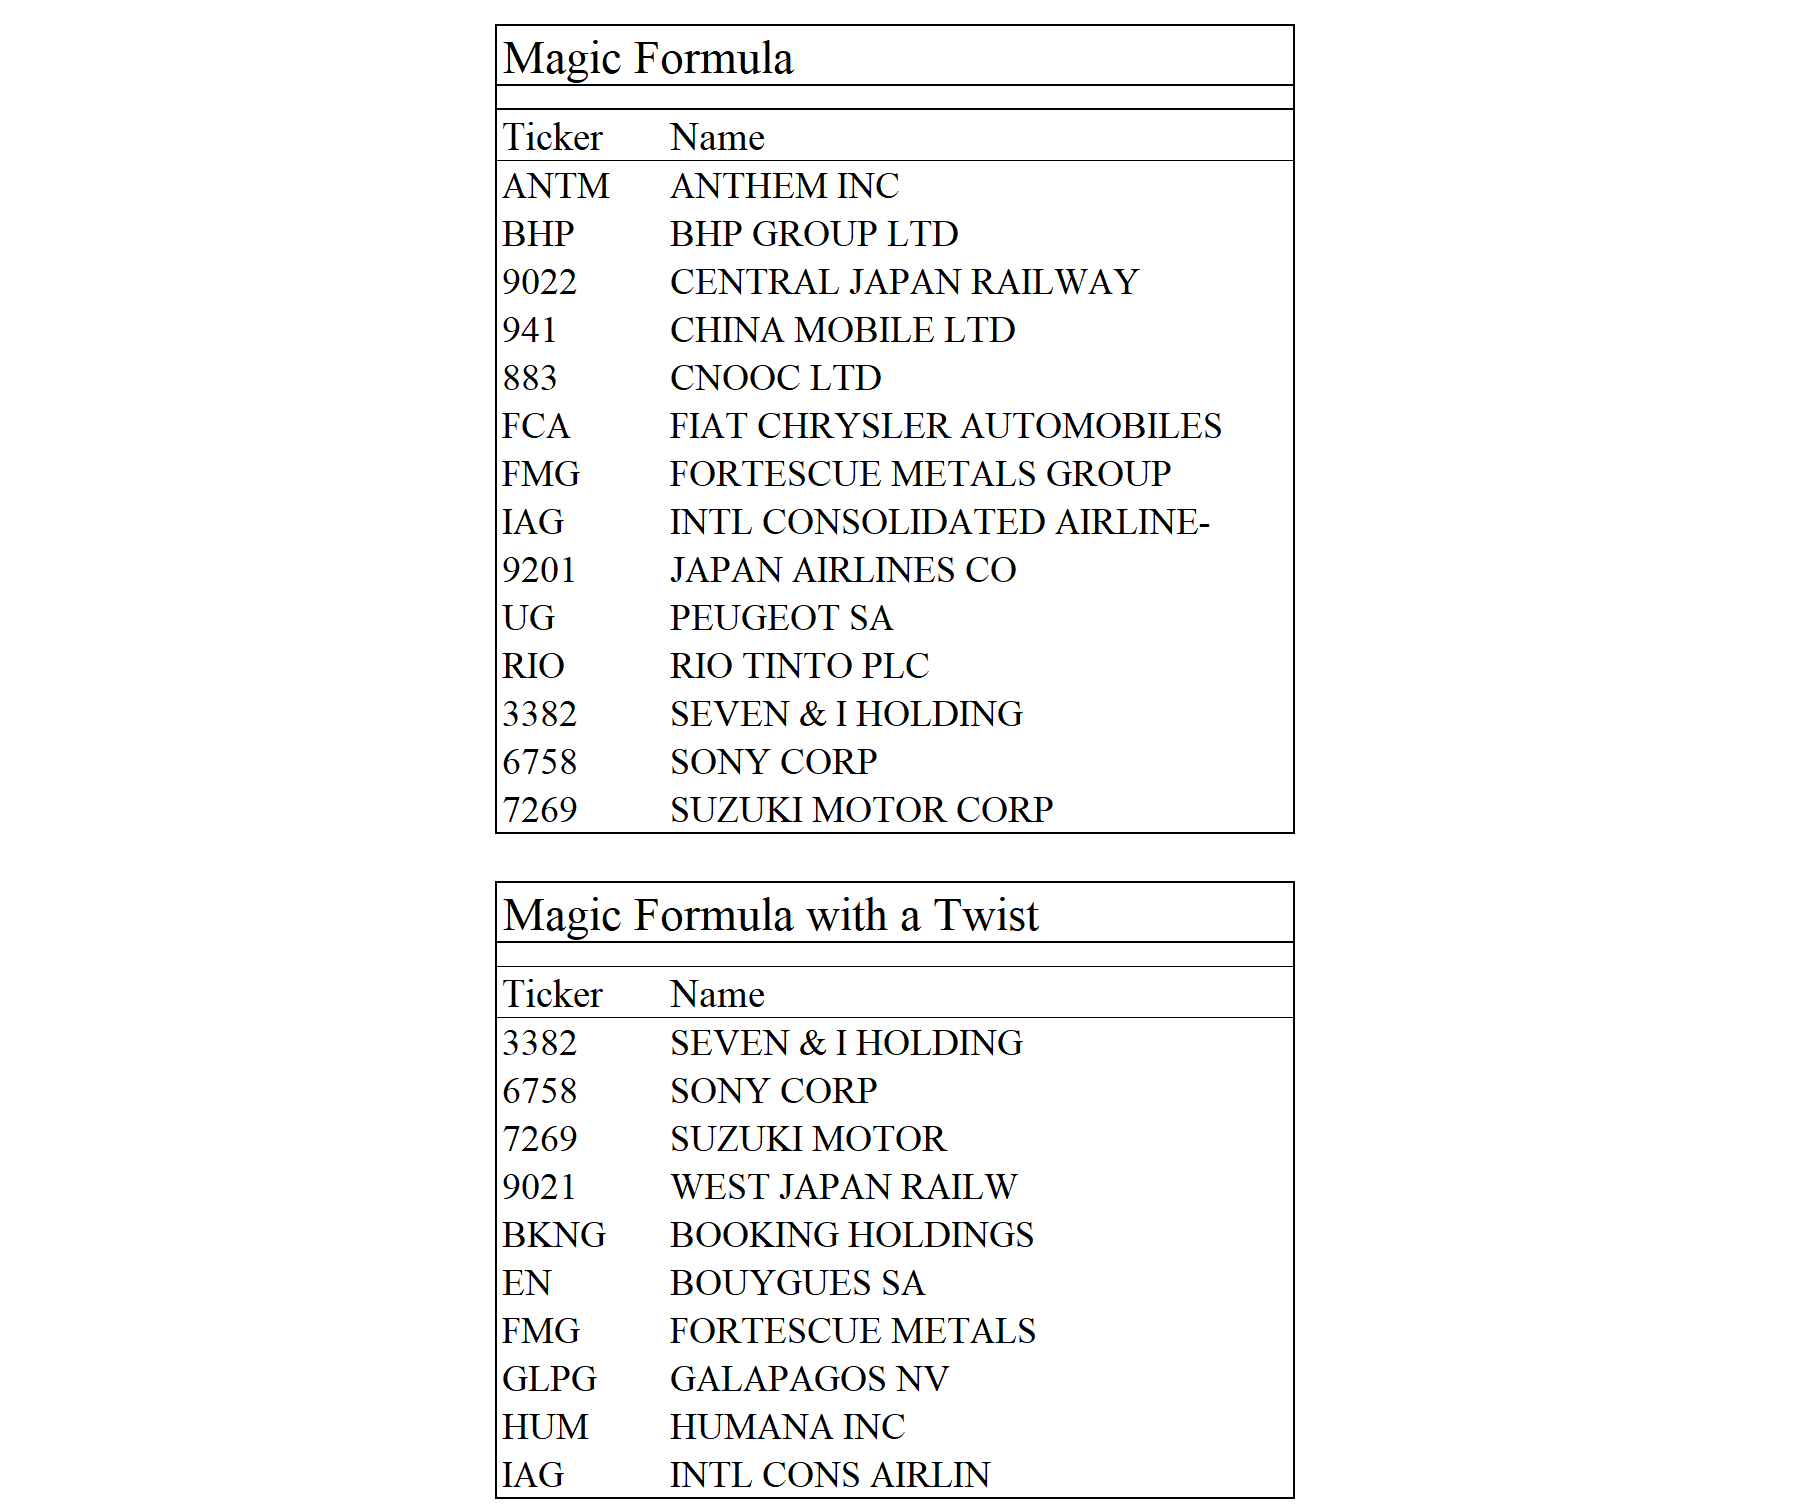
S&P Emerging BMI
Original

With a Twist

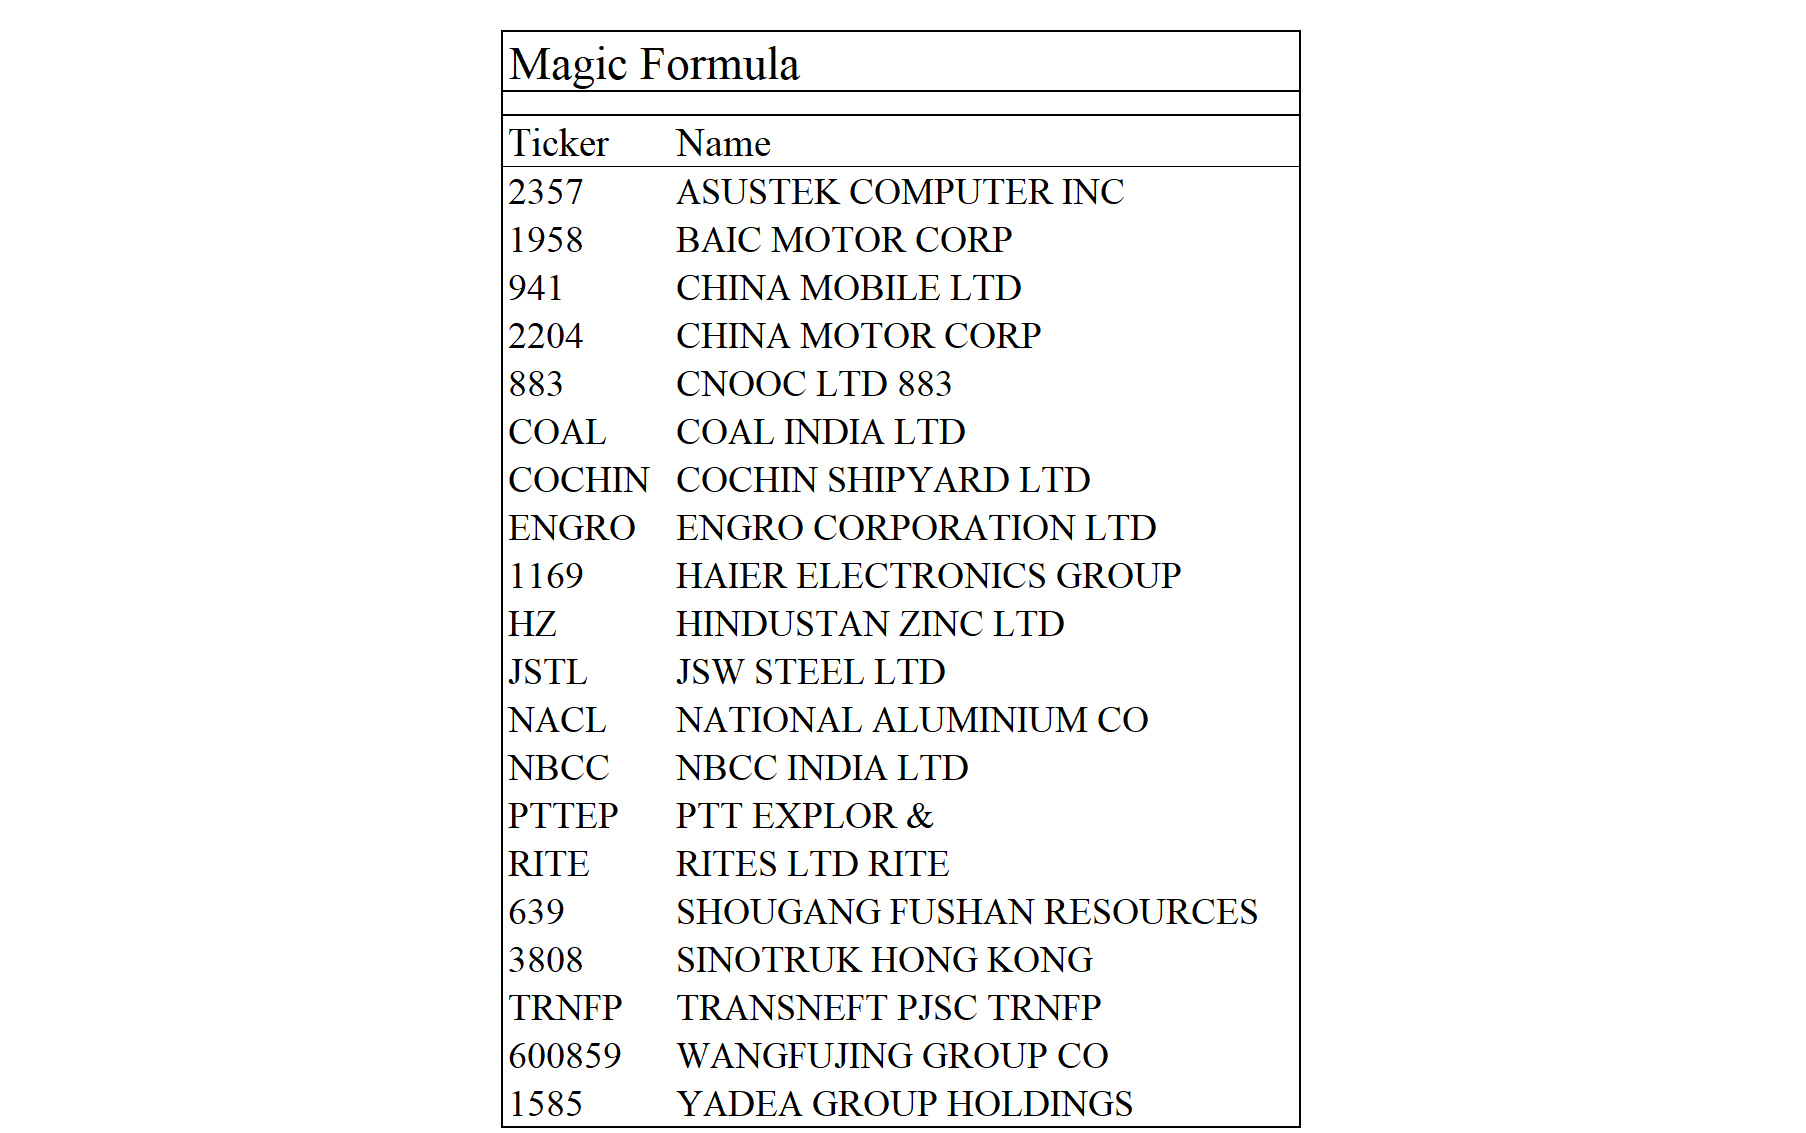
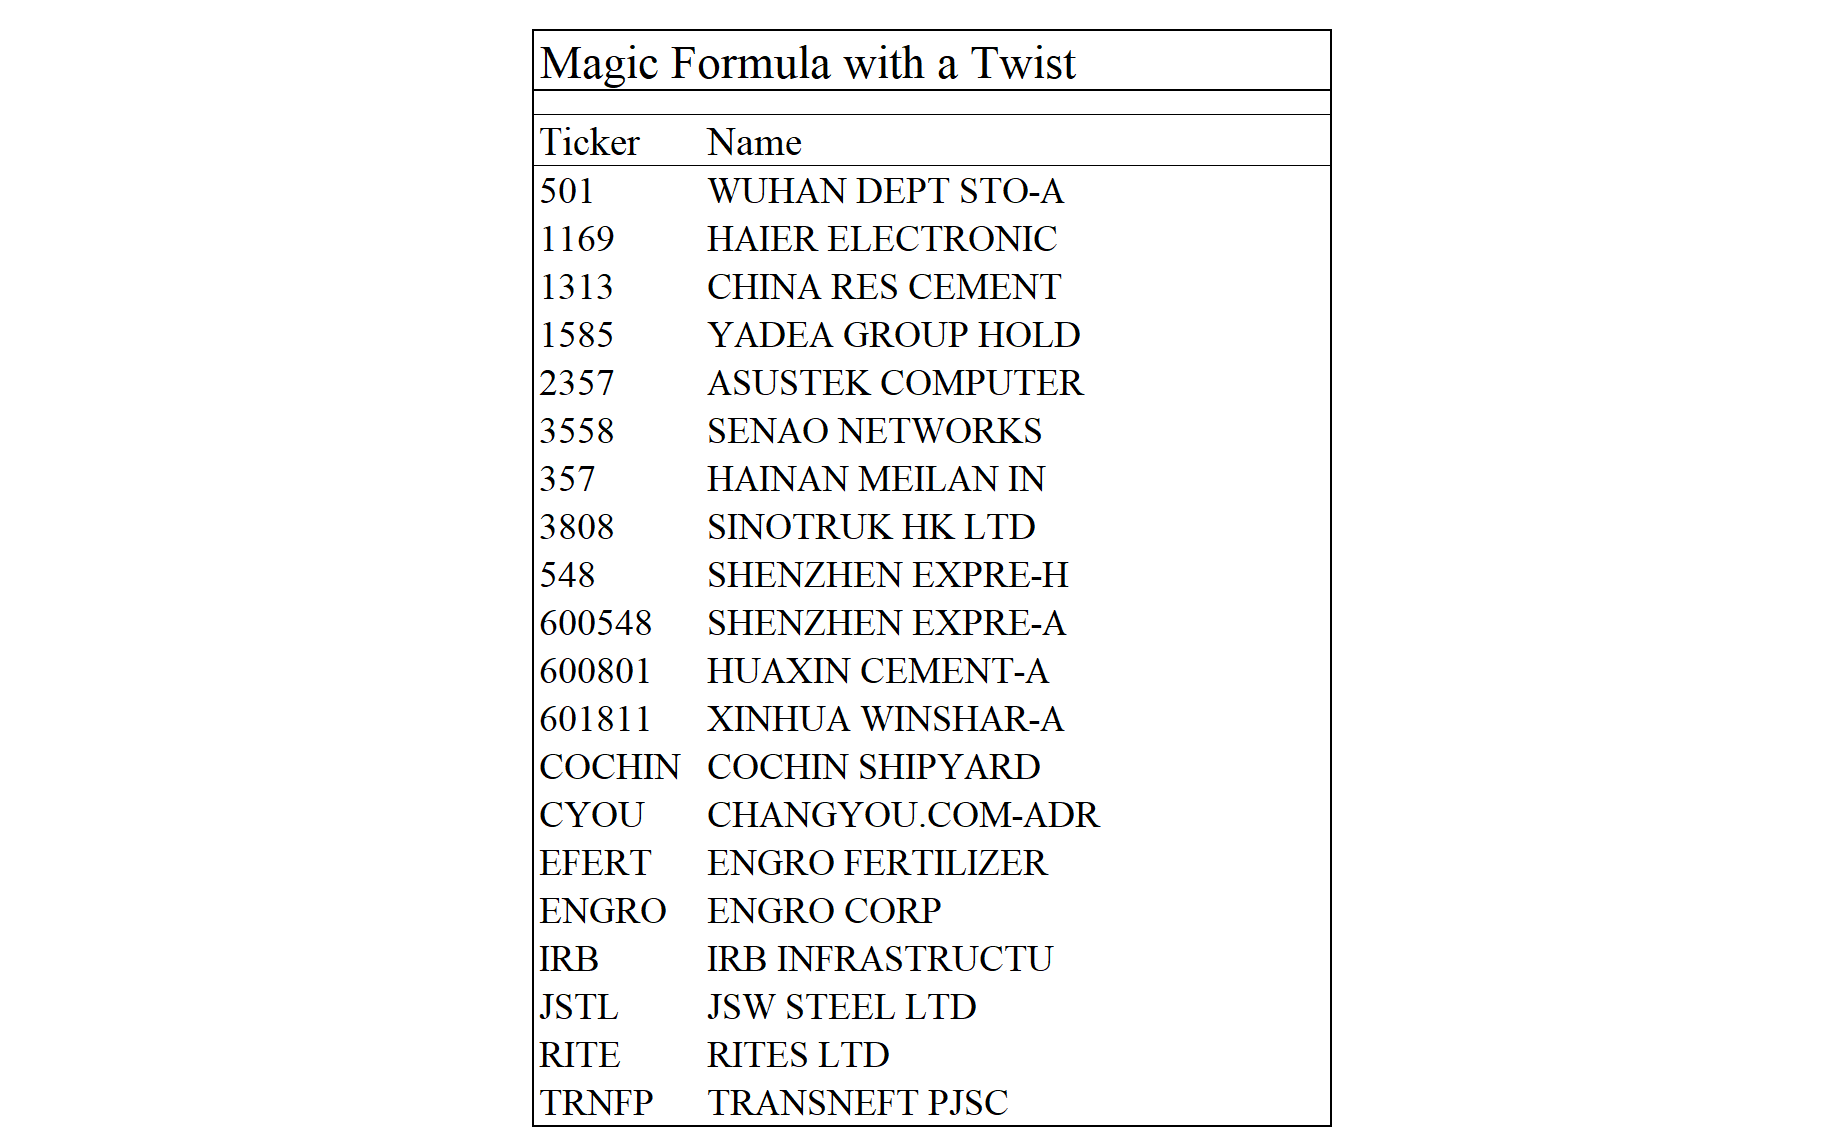
FTSE Emerging Asia Pacific
Original

With a Twist

S&P Latin America 40
Original

With a Twist

S&P/IFC Investable Eastern Europe
Original

With a Twist

Disclaimer: All information and data on this blog site is for informational purposes only. We make no representations as to the accuracy, completeness, suitability, or validity, of any information. We will not be liable for any errors, omissions, or any losses, injuries, or damages arising from its display or use. All information is provided AS IS with no warranties and confers no rights. We don’t know or understand the risk profile or time horizon of other investors so any information or opinions contained on this website are not intended to constitute a specific recommendation to make an investment. This blog is intended to share our opinions and not persuade you into to making specific investments. You need to do the homework yourself and make your own choices with your money based on your unique circumstances.