Are Dividend Aristocrats Still a Good Alternative?
In 2005, S&P came up with a new index they called the S&P 500 Dividend Aristocrats index. To be included, a member of the S&P 500 must have increased its dividend payouts for at least 25 years and a minimum market cap of USD 3b.
The strategy was intended to yield conscious relatively conservative stock investors. By selecting stocks which have increased their dividend under a long stretch of time, the assumption was that those companies were more conservatively managed and had lower earnings volatility.
Now that similar indicies (although with a smaller number of consecutive payouts increase required due to data limitation) have been created on other universes and that it has become very popular, we want to explore if it remains a good investment alternative for risk averse investors.
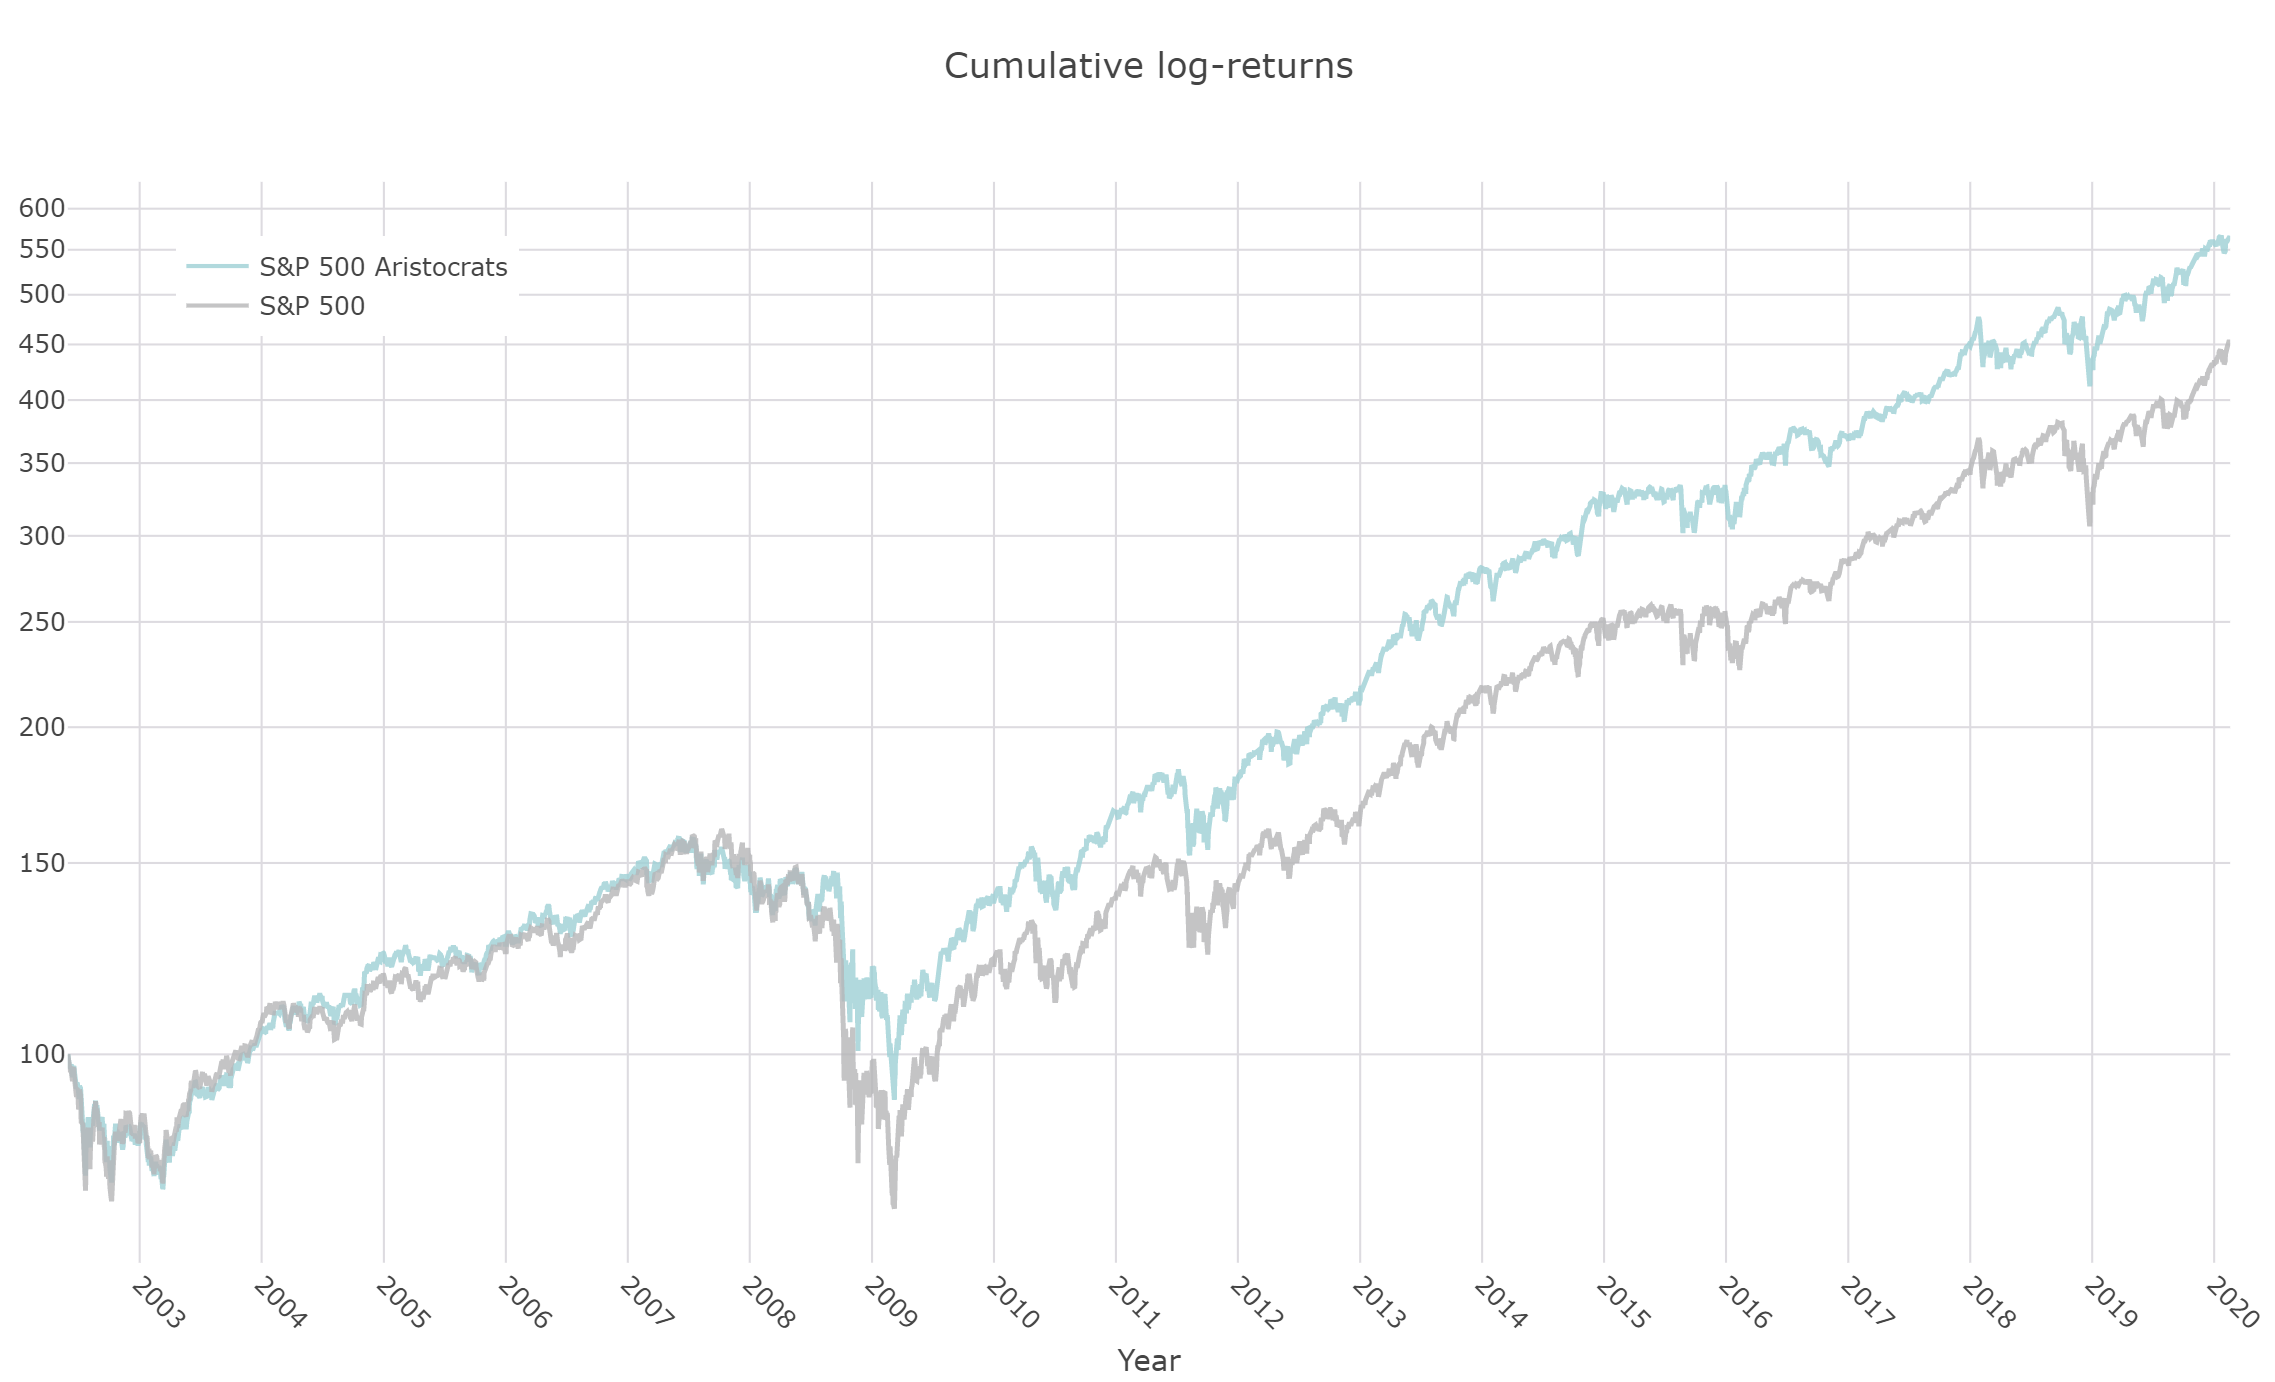
Let's first start with the relative performance of the S&P 500 Dividend Aristocrats Index relative to the S&P 500 over the last 20 years.

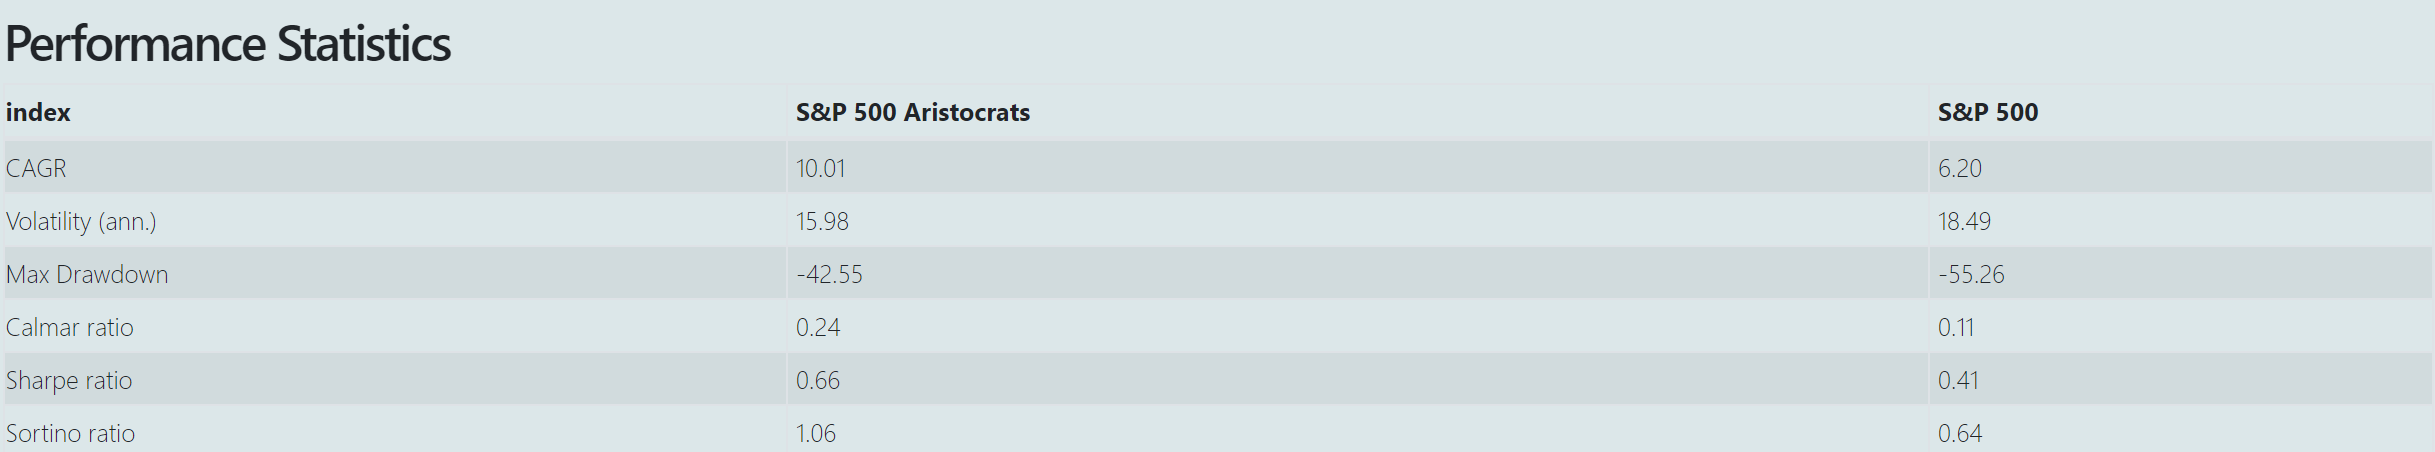
While volatility is a popular risk statistics among institutional investors, we prefer to focus on drawdowns which better define what we consider risk, i.e a complete loss of capital.
Since 2000, the S&P 500 Aristocrats has delivered what it was suppose to. It experienced a notably lower drawdown than the S&P 500.
It outperformed during the declines of 2000-2003, the tail-end of the 2007-2009 decline, the decline of mid 2015-February 2016 and the most recent volatility bout in 2018.
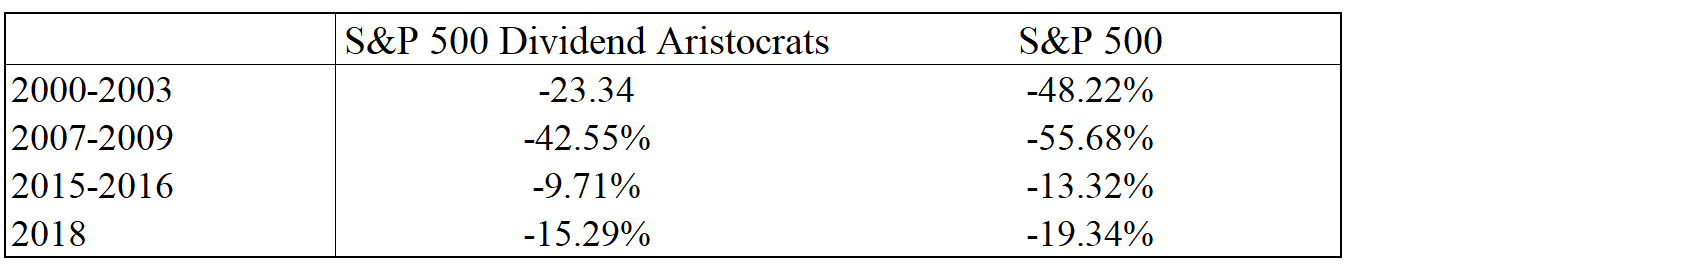
Nevertheless, it is important to remember that the period from the peak of the TMT bubble to mid-2002 saw quality, value and small cap companies regain all what they had lost between 1998-2000, and some more. During that period, while the S&P 500 was loosing almost 25%, the S&P 500 Dividend Aristocrats rose more than 65%. Removing those 2 years and we have the following picture that emerges.

Still outperforming but only by a percent or so a year.
So let's now take a look back and analyze what the relative performance drivers were and where they stand now.
While it might seem heretic to say, in today's environment, that the main determinent of the stock market valuation is not what the Governor of the St-Louis Fed, the New York Fed, the current or a previous Fed Chairman are saying, we will cross that line.
The current stock price should simply reflect the present value of the free cash flows it will be able to generate in the future. The reason why not to simply look at the current lower discount factor to increase stocks price can be found in the footnote 1.
To value one stock is tricky at best. To value a portfolio with a larger number of diversified stocks is easier (well that a big word) as it possible to make credible assumptions.
The drivers of the relative performance are:
- The initial Dividend Yield
- The initial Price Earning Ratio
- The future Price Earning Ratio
- The future Earning Growth, Payout Ratios and net Share Buybacks
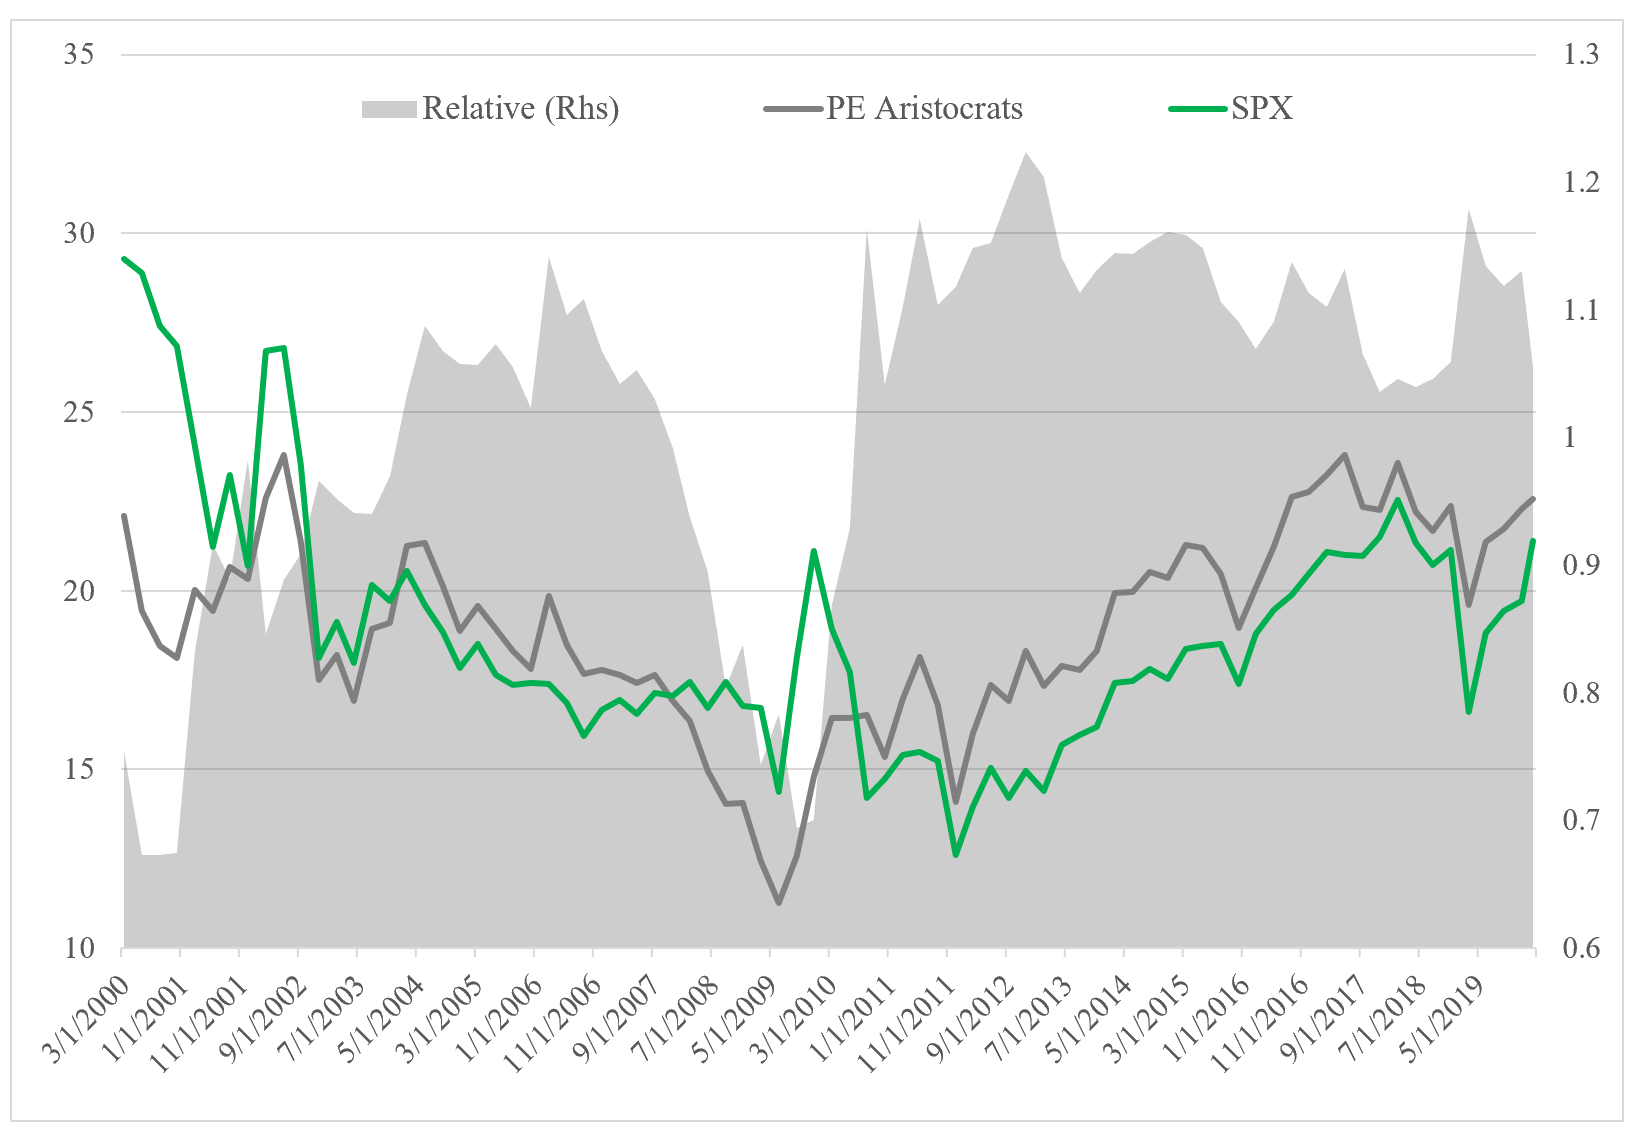
Let's have a look at some historical data on the S&P 500 Dividend Aristocrats and the S&P 500.
We will start with the dividend yield.
As said previously, the attraction of the Aristocrats stems in part by their continuously increasing high dividend payout.
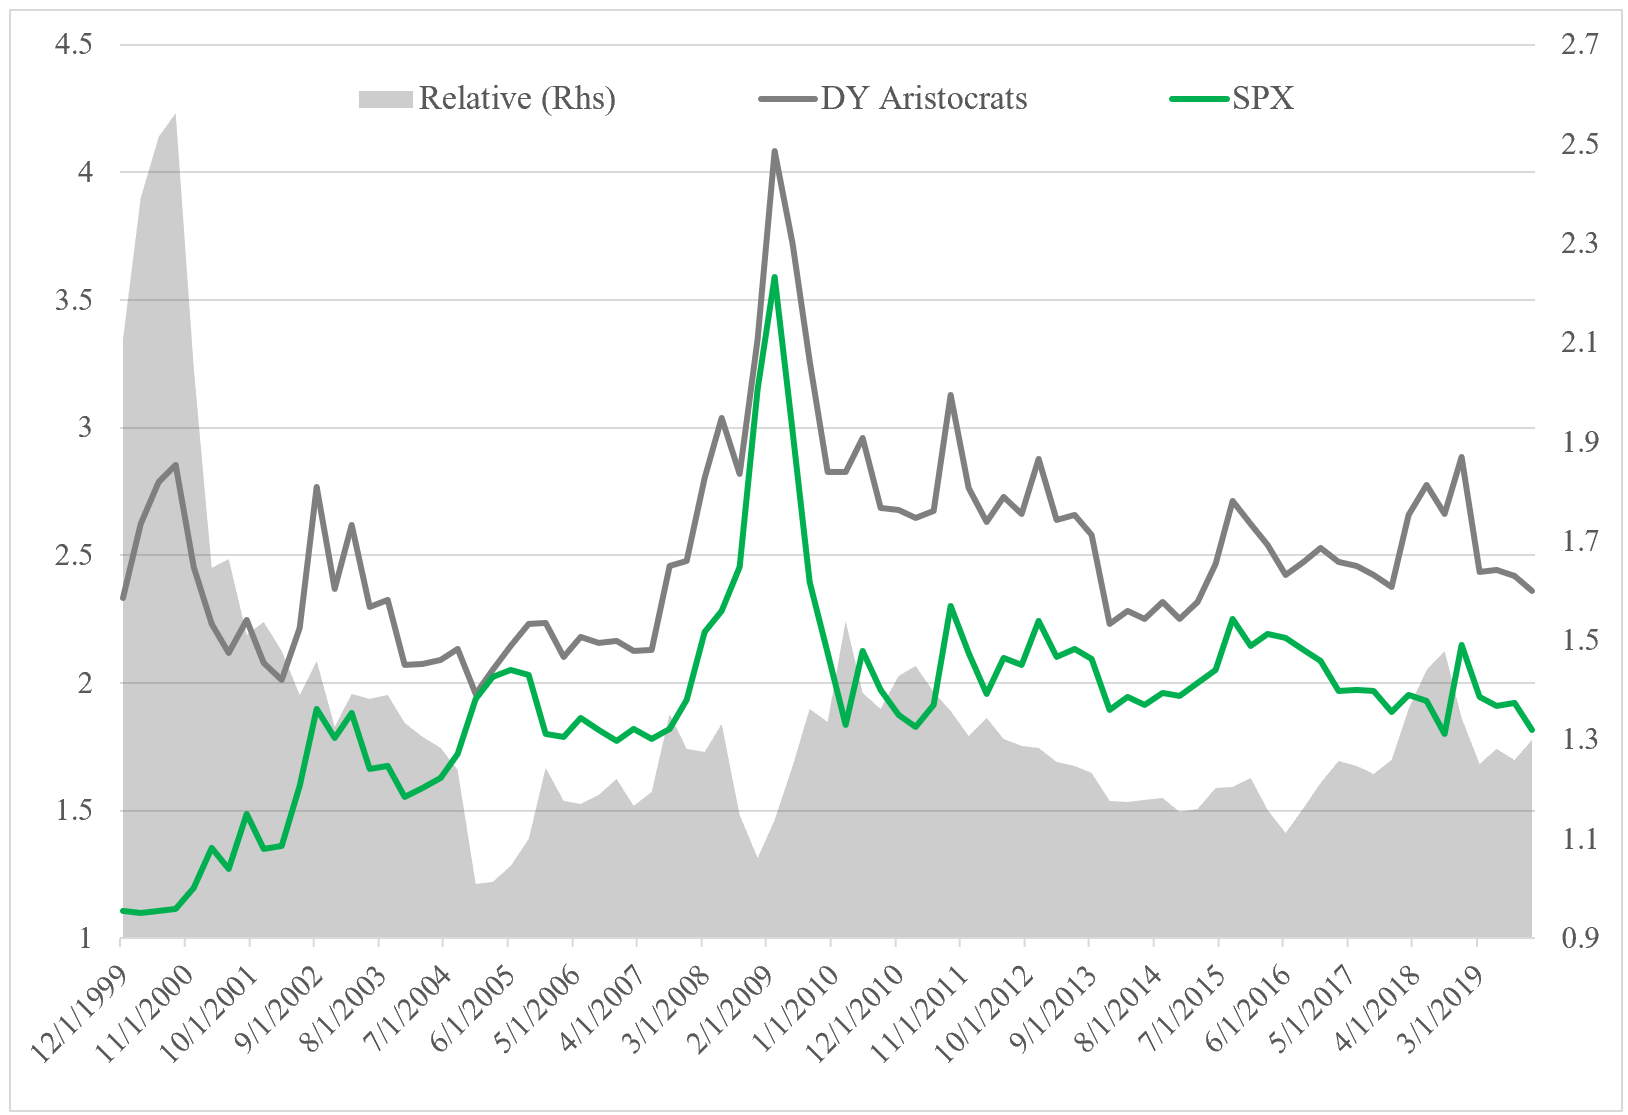
In 2000, Aristocrats had a dividend yield which was 2.5 times higher than the S&P 500.
So in 2000 one could expect Aristocrats to get 1.5-1.7% more that the broad market just from dividends.
Today this relative advantage as declined to 0.3%.
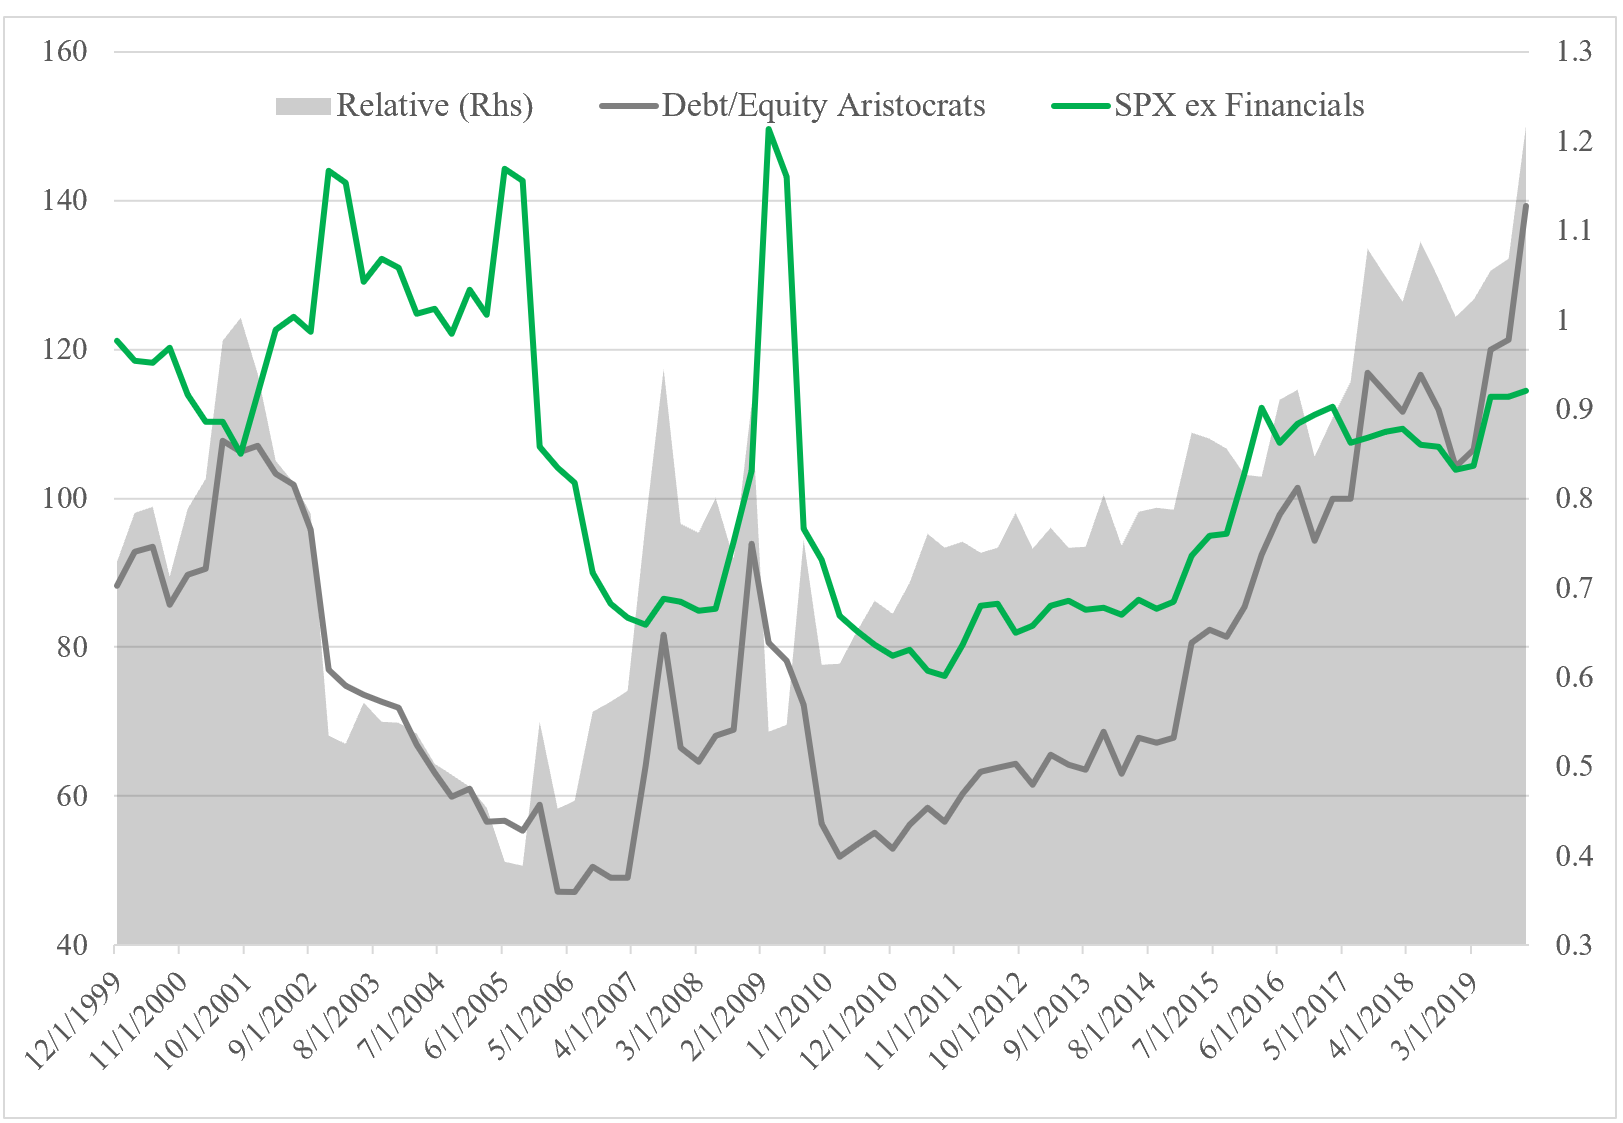
On a price earning ratio basis, Aristocrats where more than 30% cheaper than the S&P 500. Given their stronger balance sheet (and assuming similar to slightly lower growth), one could have reasonably assumed that Aristocrats should be priced equally or with a slight premium relative to the broader markets.
So in 2000, one could have assumed a 30-40% outperformance in the future. This outperformance should have been assumed to occur during 5-7 years, adding 6-7% relative CAGR to Aristocrats. Yet, this repricing happened in less than 2 years.
Today Aristocrats have a 12% premium.
If we look at the debt to equity ratio, we can see that it has increased a lot on an absolute and relative basis for the Aristocrats (ex Financials).
Their balance sheets margin of safety is slowly eroding and hence reduce (or even eliminate) the size of the premium investors should be ready to pay, ceteris paribus, relative to the broader market.
We will nevertheless assume that Aristocrats still deserve to trade at a premium to the market.
Turning to the last part of the equation, it is hard to make any predictions about future relative growth, payout ratios and net share buybacks. We will assume that they won't have any meaningful influences of future relative performance (in down market they will, as buybacks and dividends are more likely to be sustained for Aristocrats given their lower earning volatility and stronger balance sheet, in theory...).
All in all, the S&P 500 Dividend Aristocrats have lost most of the relative advantages they had in 2000 when they could have conservatively been expected to outperform the broader market by 7.5-8.5% annually (1.5% from dividend and 6-7% from relative repricing).
With a dividend yield 0.3% higher than the market, a premium valuation and deteriorating relative balance sheet, we would be hard pressed to forecast any meaningful out or underperformance.
Given their balance sheet, income and cash flow dynamics, their are likely to outperform the broader markets during any meaningful decline but anyone expecting a repeat of the 2000-2002 episode is likely to be sorely disappointed.
We would assume that they are likely to experience a decline of 80-85% the size of the broader market.
1. An error which is often made today is to assume that because risk-free rate (used to discount future cash flows) have declined stocks price should rise .
J. Hussman puts it rightly when he writes:
"Worse, there is a great deal of evidence to support the assertion that interest rates are low because structural economic growth rates are also low. In that kind of environment, a proper discounted cash flow analysis would show that no valuation premium is “justified” by the low interest rates at all. Hiking valuation multiples in response to this situation only adds insult to injury."
Rates are low because future nominal growth is expected to be low. With record employment, future growth will be a function of new addition to the workforce and productivity.
Given current projection, the workforce will experience its slowest growth since WWII in the coming decade. Productivity has been rising but slowly and we should not expect it to grow much faster. Expecting more than 1 to 1.5% real GDP growth for the next 10 years would likely lead to big disappointment.
If we are wrong on nominal growth, risk free rate will rise, and future growth will be discounted with a higher rate.
Disclaimer: All information and data on this blog site is for informational purposes only. We make no representations as to the accuracy, completeness, suitability, or validity, of any information. We will not be liable for any errors, omissions, or any losses, injuries, or damages arising from its display or use. All information is provided AS IS with no warranties and confers no rights. We don’t know or understand the risk profile or time horizon of other investors so any information or opinions contained on this website are not intended to constitute a specific recommendation to make an investment. This blog is intended to share our opinions and not persuade you into to making specific investments. You need to do the homework yourself and make your own choices with your money based on your unique circumstances.