An Introduction to the NAVA Toolbox
The NAVA Toolbox allows to quickly perform standard financial analysis on time series
We decided to allow anyone to take advantage of some tools we constantly use at NAVA Capital.
Investors and financial managers often need to perform similar tasks, like analyzing financial time series, comparing two investments, adjusting gross performance by management fees, performance fess and so on.
Doing it in Excel is time consuming, error prone and unpractical. Doing it in Python is straightforward for anyone with some programming knowledge. Our tool allows anyone, without any programming knowledge, to leverage the power of Python. The only thing that we request from the user is to tidy their data and save it as a CSV or Excel file!
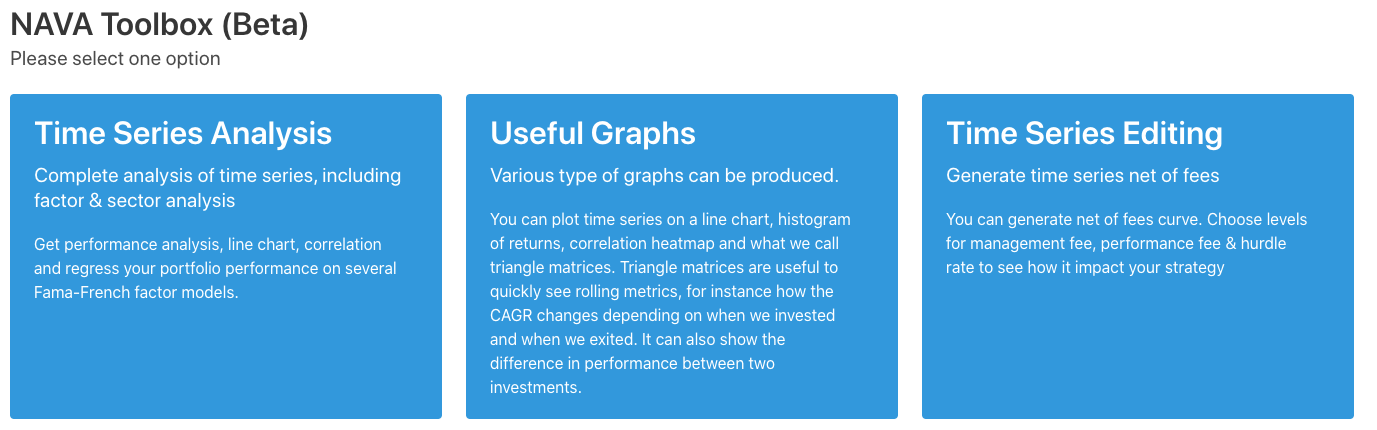
We propose three main categories:
Time Series Analysis
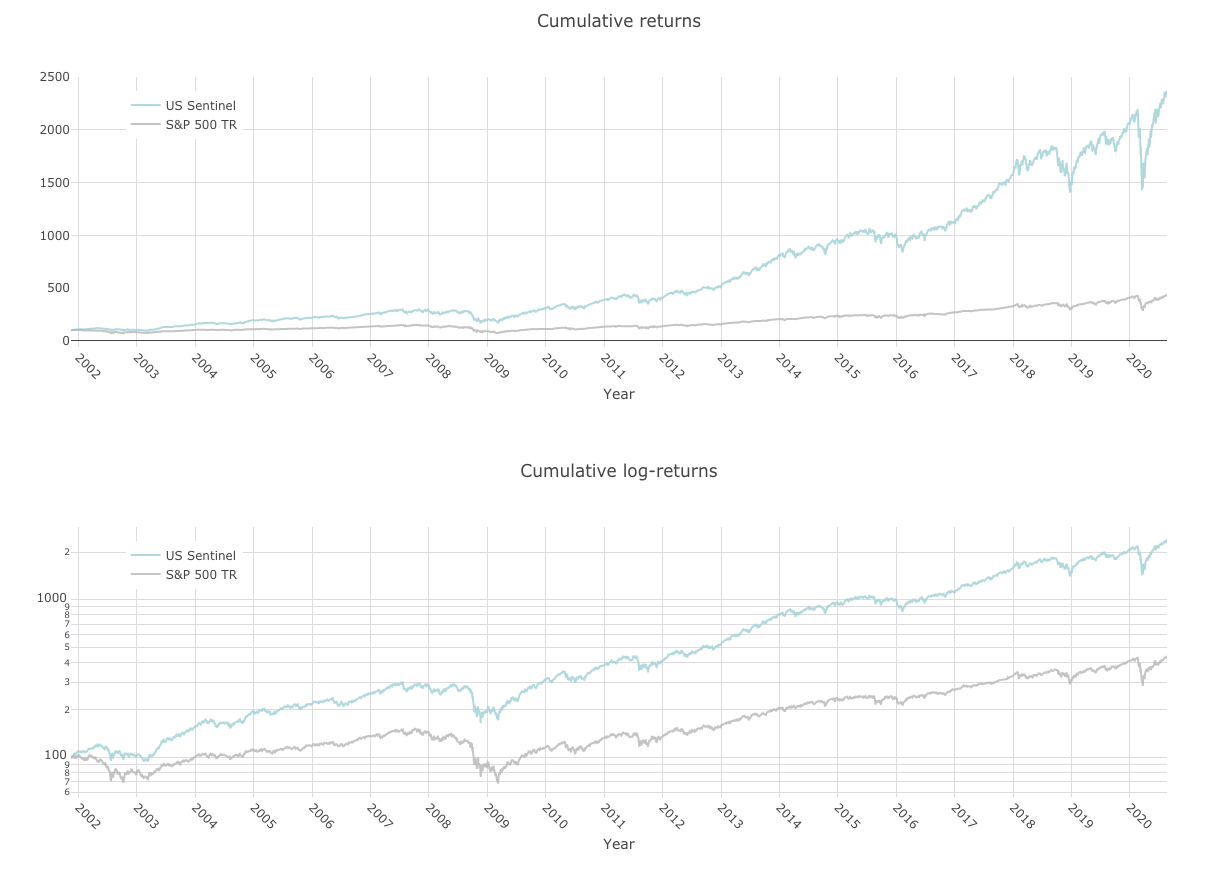
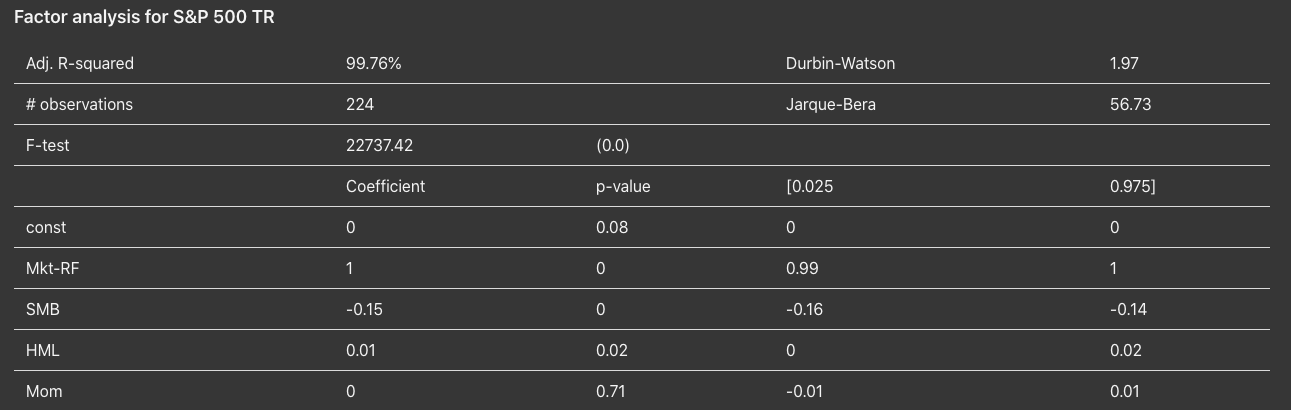
This tool performs a complete analysis of time series, including factor & sector analysis via OLS regression. We offer a large number of models to choose from, such as Fama-French 3 factors model US, Europe, Asia ex-Japan etc. It generates several plots:
1) Cumulative Returns & Cumulative log-Returns
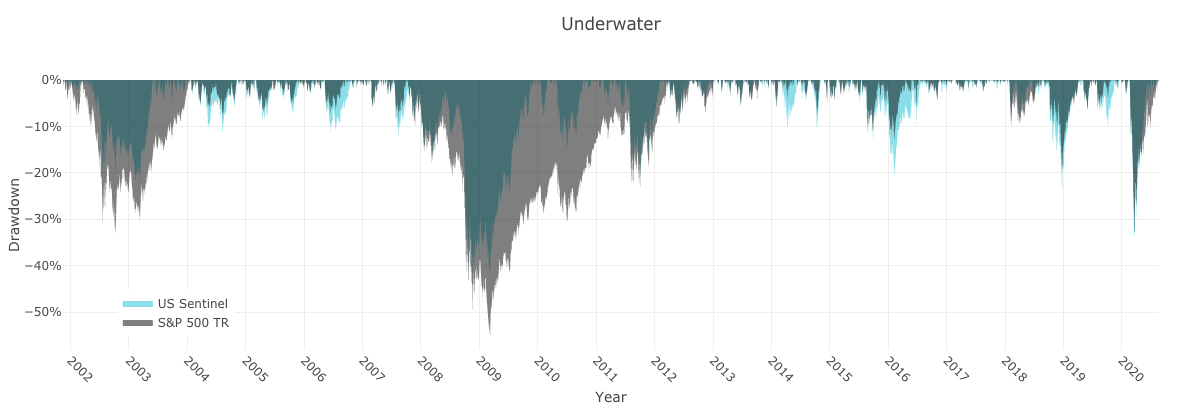
2) Underwater (drawdown)
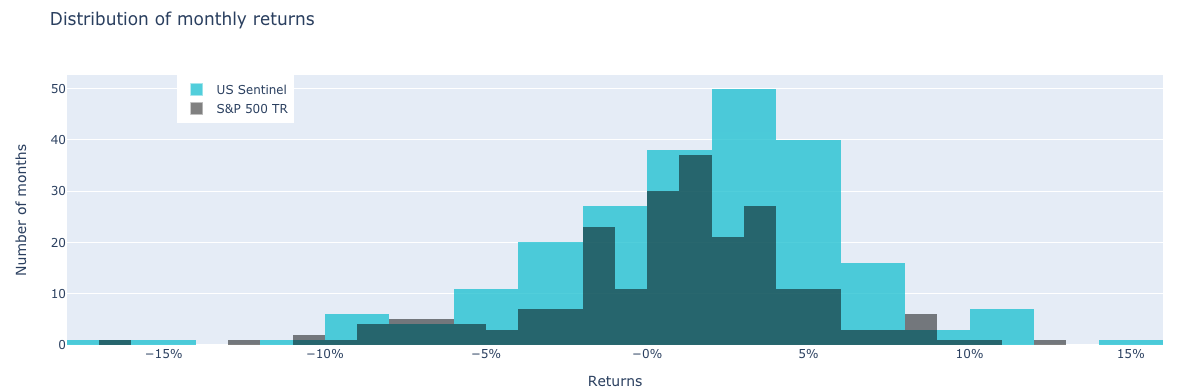
3) Distribution of monthly returns
and several tables:
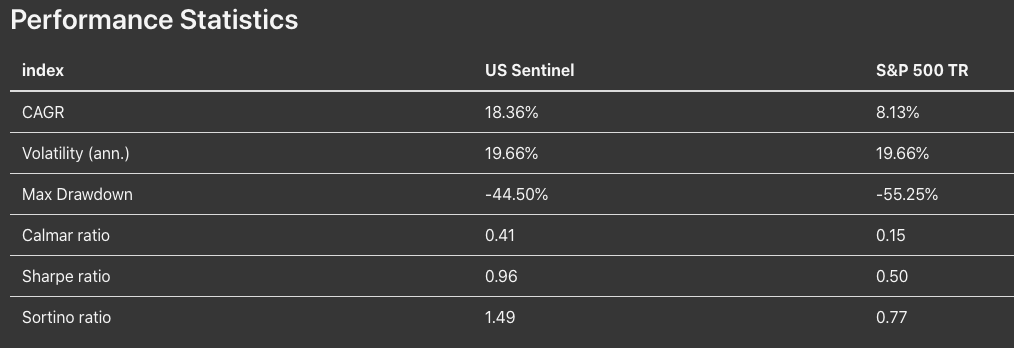
1) Performance Statistics
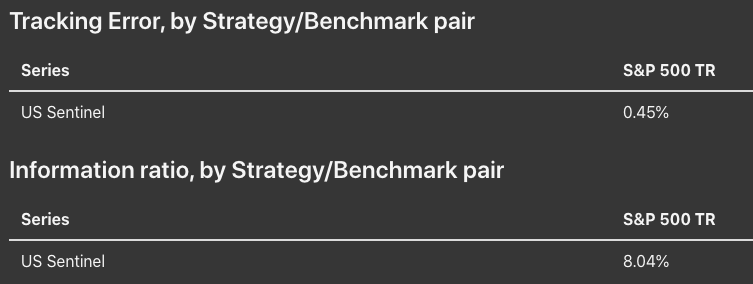
2) Tracking Error & Information Ratio
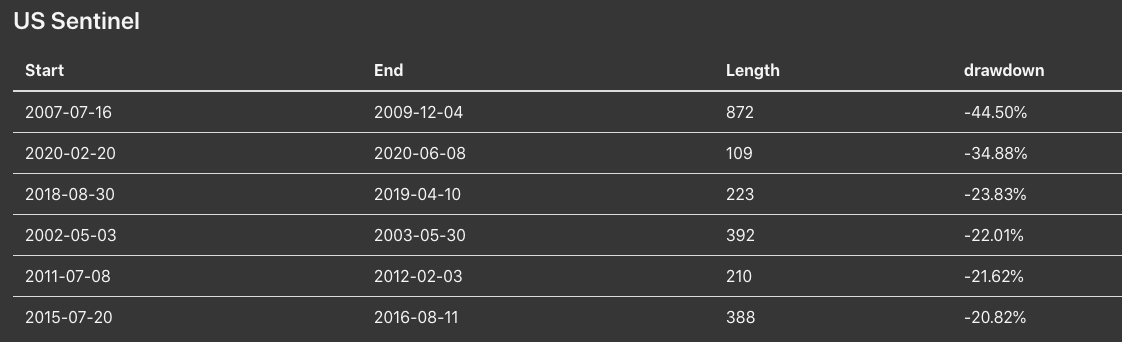
3) Largest Drawdowns
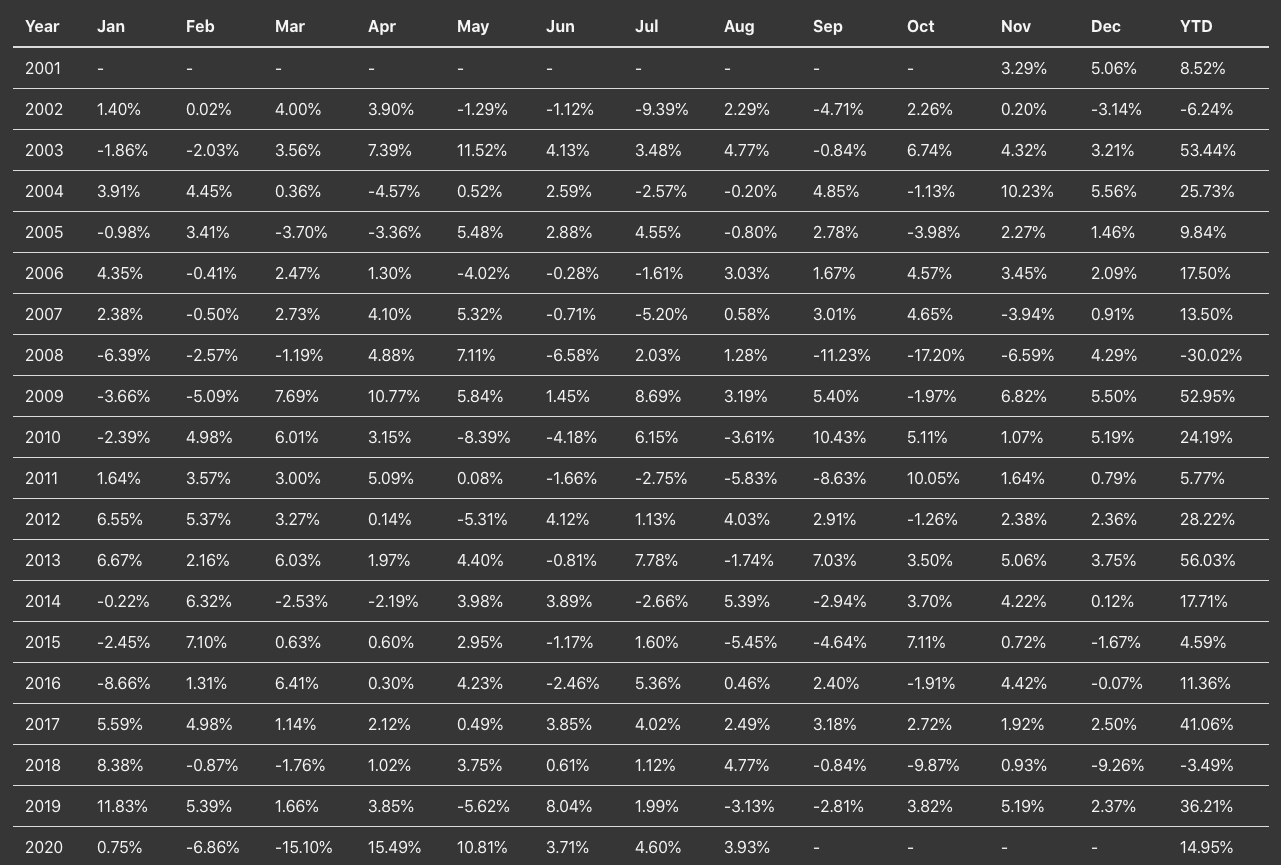
4) Monthly & Yearly Return Table
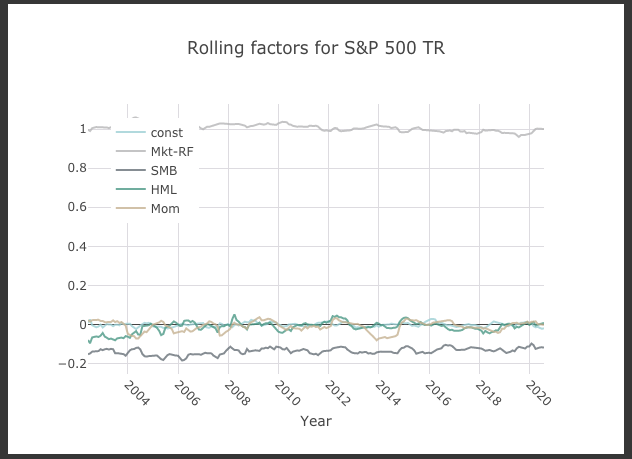
5) Factor Model Sensitivities & rolling plot
Useful Graphs
This section allows to quickly create some of the most used graphs in finance.
First, one can plot the same graphs than in the Time Series Analysis tool but at the individual level, in case one doesn't want to get the full analysis.
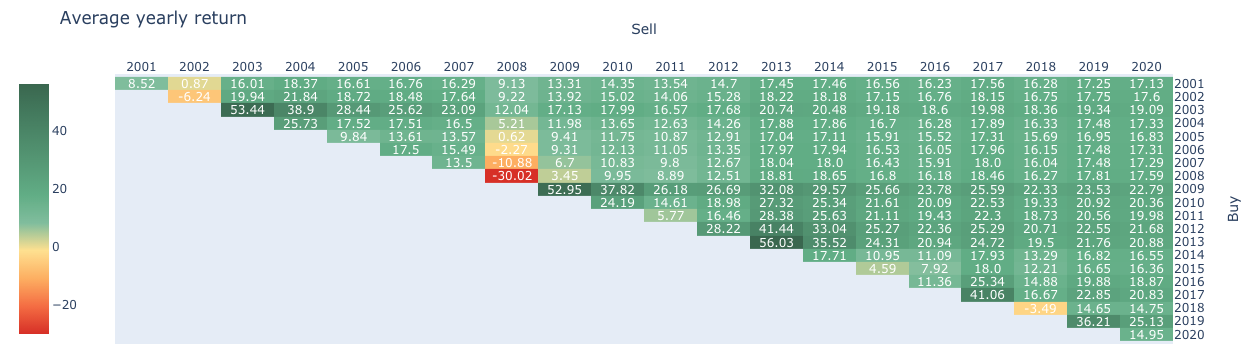
We also added a correlation heatmap and what we call "triangle" graphs. It shows the performance depending on the holding period and date of investment. Obviously a nice return to risk ratio is required for a strategy over the long run but seeing what would have happened at different holding horizon is a must. Not realizing for how long a strategy has underperformed in the past is a recipe for abandoning it at the worst time! A triangle graph could easily show investors why holding on could be a better idea!
Time Series Editing
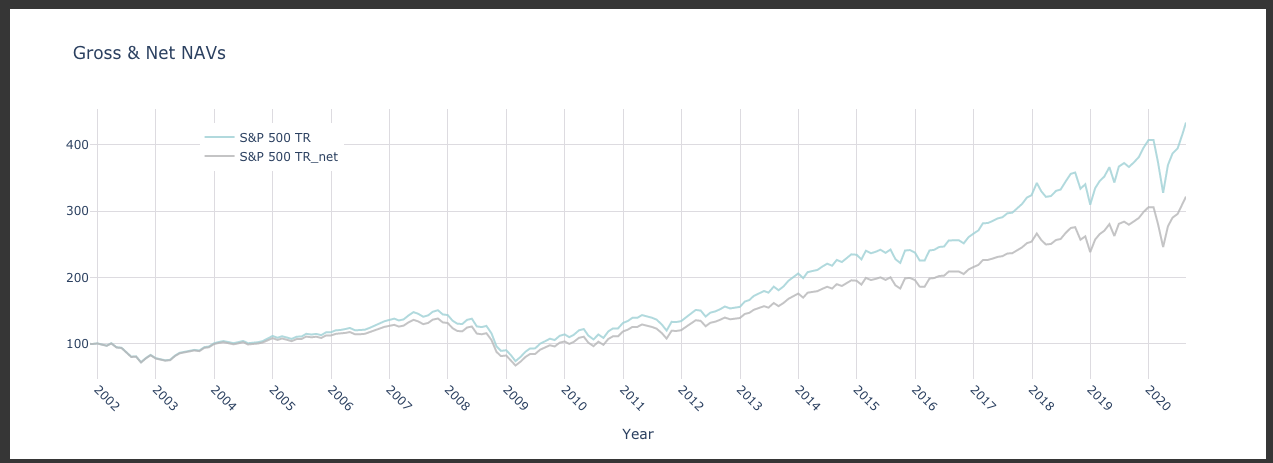
Investors sometimes get stellar gross return time series from funds. At first glance, it looks great but just how much less will the investor get once we get all the fees into account?
This last tool allows to compute just that. One can adjust any time series for management fees (can proxy turnover cost), performance fee and hurdle rate.
The tool returns a line chart and adjusted time series as a CSV file.
Conclusion
We hope this suite of tools can be of use to some of our readers. Interested in having custom reports generated on a regular basis? We also offer tailor-made reporting tools where one can simply add updated time series and get back a full fledged PDF or PPT report with the layout they wish. In the meantime, feel free to play with our tools at https://tools.nava.capital